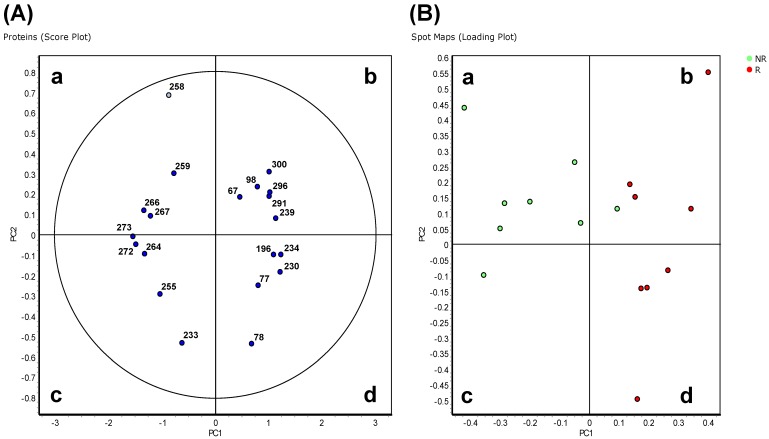
Figure 2.
Principal component analysis of Hodgkin Lymphoma plasma samples of the 'explorative' cohort. Depending on the setting of the performed calculation, differential protein spots (p<0.01) and spot maps are shown in the score plot (A) and spot maps (B). In (A) each circle represents a differential spot. In (B) each circle represents a spot map corresponding to a single patient.

