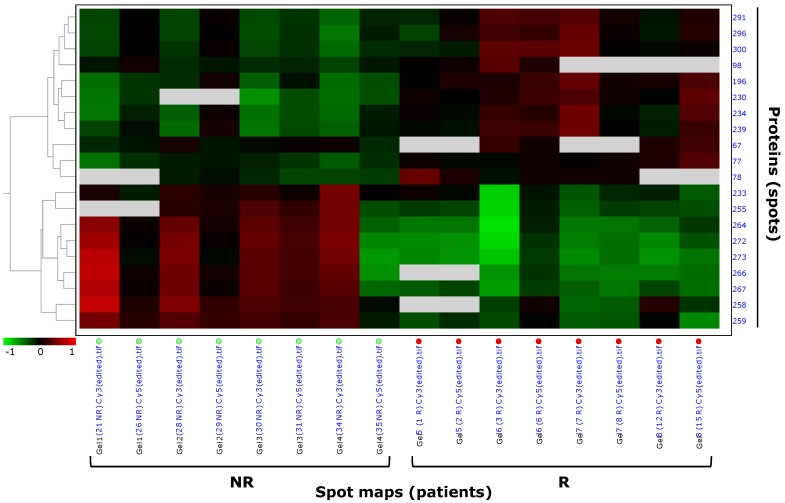
Figure 3.
Pattern analysis by hierarchical clustering of Hodgkin Lymphoma plasma samples of the 'explorative' cohort. Hierarchical clustering performed as 'Proteins - Spot maps' clustered the 20 proteins of the selected data set based on their expression from the spot maps (as explained in §'Materials and methods'). Proteins with similar expression profiles (i.e. similar expression over the spot maps) were clustered together. The dendogram on the left ordered the data so that similar data were displayed next to each other. Proteins with similar expression profiles were grouped together and spot maps/experimental groups (R, relapsing; NR, not relapsing) with similar overall protein expression were grouped together.

