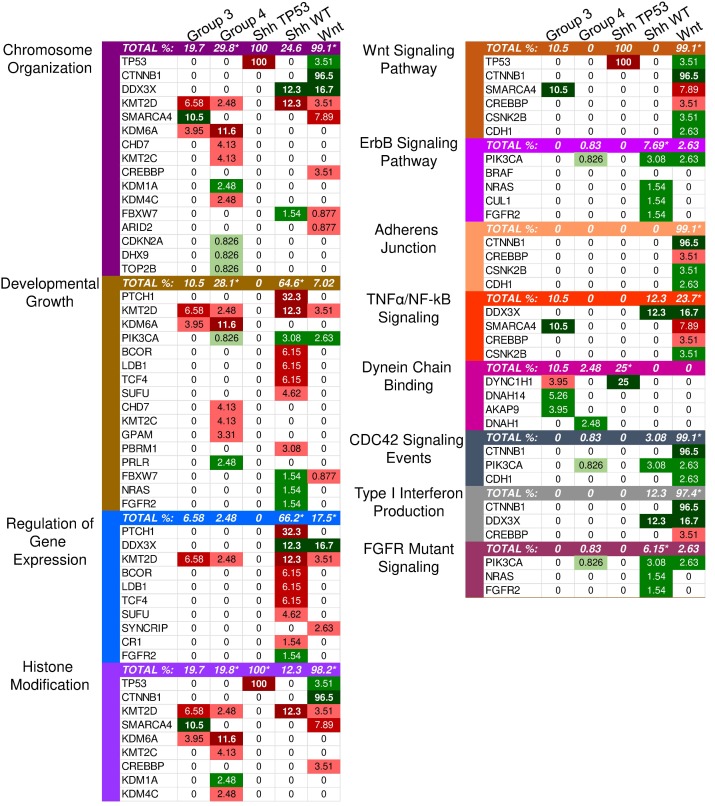
Figure 1.
Enriched pathways in molecular medulloblastoma subgroups. This figure demonstrates the enriched pathways in the molecular medulloblastoma subgroups (SHH-activated, Wnt-activated, group 3, and group 4). Green indicates gain-of-function mutations and red suggests loss-of-function. The darker the color, the higher the percentage in the sample. An asterisk "*" is used to indicate the enriched pathways (q < 0.05) per subgroup as specified by the GSEA methods.

