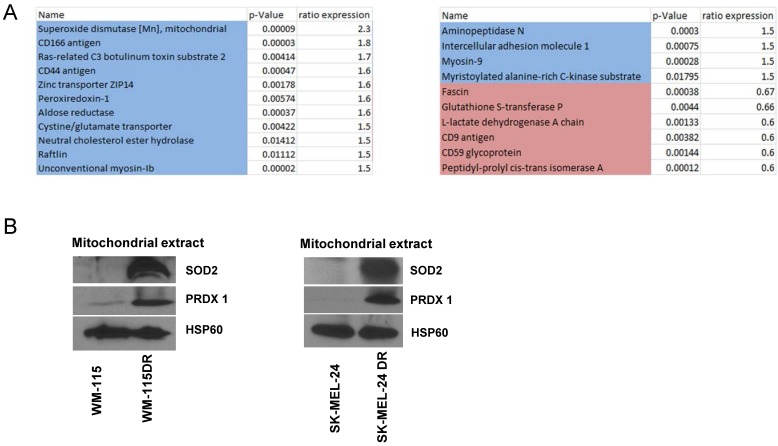
Figure 6.
Proteomics and immunoblotting analyzing antioxidant enzyme levels in dabrafenib resistant and sensitive cell lines. (A) Six samples of mitochondrial fractions from human melanoma cell lines from WM-115, WM-115DR were collected. Protein changes by comparing a common control pool of all samples by iTRAQ labelling and nano LC-MS/MS were identified. Protein fold change greater than 1.5x were shown in the panel. Blue highlight means more in resistant cells, red means less in resistant cells. Samples were conducted in triplicates. (B) Mitochondrial extracts were collected from WM-115, WM-115DR, SK-MEL-24, SK-MEL-24DR, and SOD2 level was analyzed. HSP60 served as loading control.

