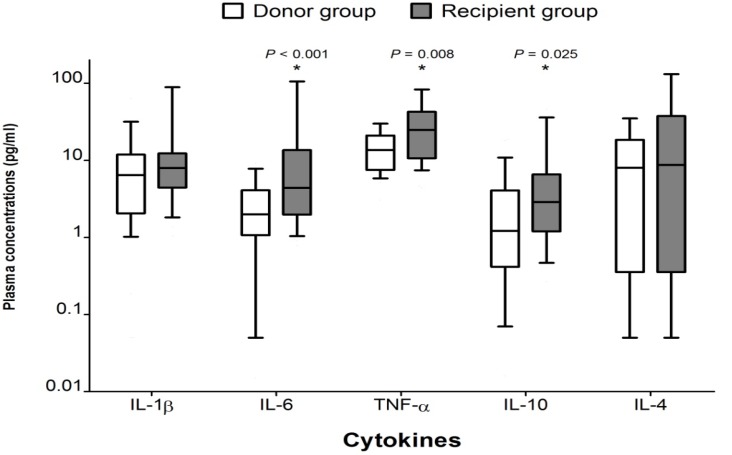
Figure 1.
Comparison of preoperative cytokine concentrations between groups. The box plots show the median (line in the middle of the box), interquartile range (box), and 10th and 90th percentiles (whiskers). * P < 0.05 versus donor group. [from Ref. 16. Hong SH, Kim JE, Cho ML, Heo YJ, Choi JH, Choi JH, Lee J. Comparison of the Child-Turcotte-Pugh classification and the model for end-stage liver disease score as predictors of the severity of the systemic inflammatory response in patients undergoing living-donor liver transplantation. J Korean Med Sci 2011; 26: 1333-1338.]

