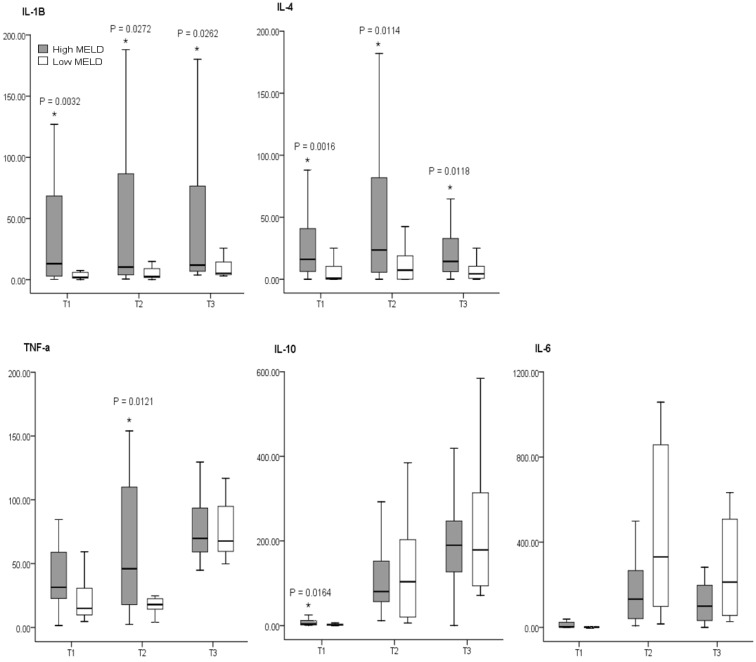
Figure 3.
Comparison of cytokines concentrations between MELD-based groups. The box plots show the median (thick line in the box), interquartile range (box), and range (whiskers). All cytokines concentrations are pg/ml in value. MEDL: model for end-stage liver disease, High MELD≥20, Low MELD<20, Time 1: after induction of anesthesia, Time 2: 60 min after the start of anhepatic stage, Time 3: 60 min after reperfusion. *: P<0.05 vs Low MELD. [from Ref. 17. Koh HJ, Ryu KH, Cho ML, Heo YJ, Lee J. Factors influencing the concentration of cytokines during liver transplantation. Transplant Proc 2010; 42: 3617-3619.]

