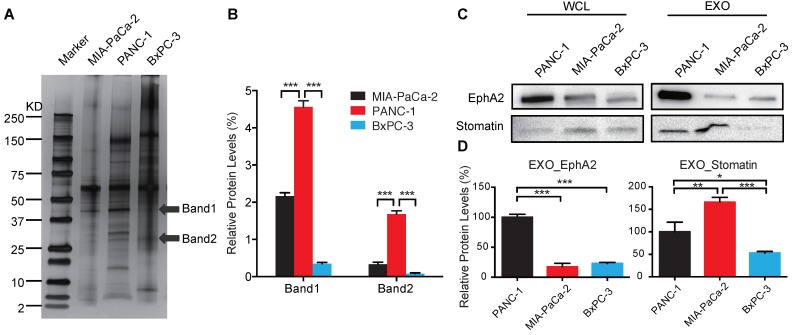
Figure 2.
Identification of candidate exosome chemoresistance proteins. (A) Western blot of exosomal proteins of MIA PaCa-2, PANC-1, and BxPC-3 cells (arrows indicate protein bands subjected to LC-MS/MS sequence analysis). (B) Relative expression of selected exosomal protein bands normalized to the sum of the band densities in each lane. (C) Western blot of candidate proteins in WCLs and EXOs of PANC-1, MIA PaCa-2, and BxPC-3 cells. (D) Relative exosome EphA2 and Stomatin expression. Data indicate mean±SD (n=3); *p<0.05, **p<0.01, ***p<0.001.

