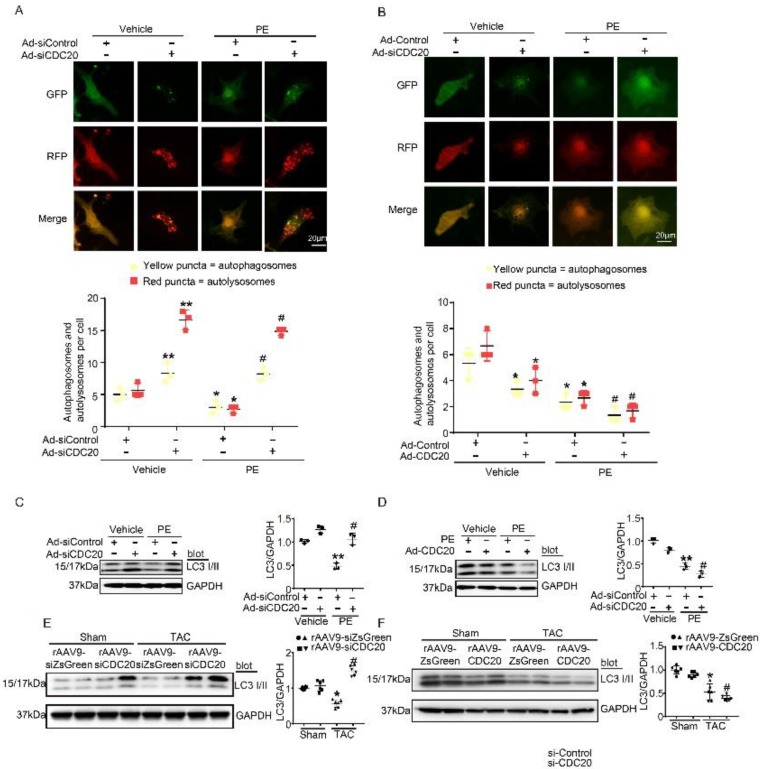
Figure 4.
CDC20 regulates autophagic flux and LC3 stability. (A) Immunofluorescence showing the autophagic flux after treatment with PE and/or si-CDC20. Scale bar: 40 μm (n=3). (B) Immunofluorescence showing the autophagic flux after treatment with PE and/or CDC20 (n=3). (C) Representative Western blot showing the expression of LC3 I/II after transfection with siCDC20 and treatment with phosphate-buffered saline or PE for 72 hours (n=3). (D) Representative Western blot showing the expression of LC3 I/II after transfection with CDC20 and treatment with phosphate-buffered saline or PE for 72 hours (n=3). (E) Representative Western blot showing the expression of LC3 I/II in heart samples from rAAV9-siZsGreen- and rAAV9-siCDC20-treated mice following sham operation or TAC. * P < 0.05 vs. sham; # P < 0.05 vs. the rAAV9-siZsGreen plus TAC group (n=6). (F) Representative Western blot showing the expression of LC3 I/II and GAPDH in heart samples from rAAV9-ZsGreen- and rAAV9-CDC20-treated mice following sham operation or TAC (n=6). * P < 0.05, ** P < 0.01; # P < 0.05.

