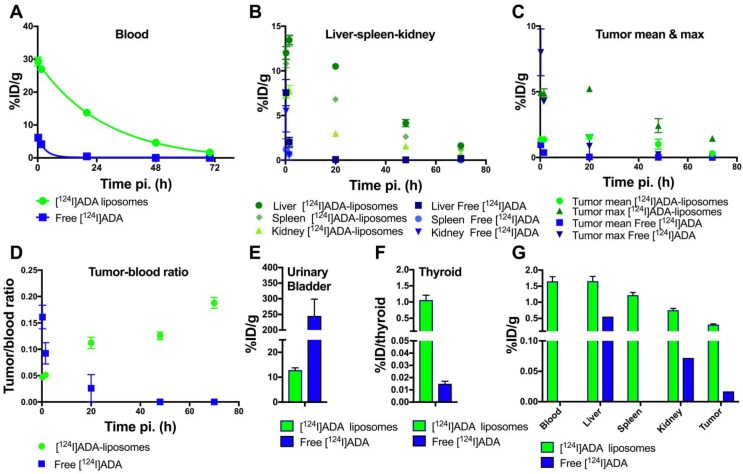
Figure 5.
PET-derived biodistribution of free [124I]ADA and [124I]ADA loaded liposomes. (A-E) The accumulation of free [124I]ADA (n = 3) and [124I]ADA-loaded liposomes (n = 5) in (A) blood, (B) liver, kidney and spleen, (C) tumor, and (D) tumor-to-blood ratio are shown as a function of time post injection (pi.). The radioactivity in the urinary bladder (E) was measured 15 min post injection. The results are presented as mean ± SEM for all organs and blood, whereas the tumor is given as both mean ± SEM and max ± SEM. (F-G) Ex vivo biodistribution data, 72 h post injection, of free [124I]ADA (n = 3) and [124I]ADA-loaded liposomes (n = 5), based on organ well counting. The data are presented as mean ± SEM. The thyroid uptake is expressed as %ID ± SEM per thyroid.

