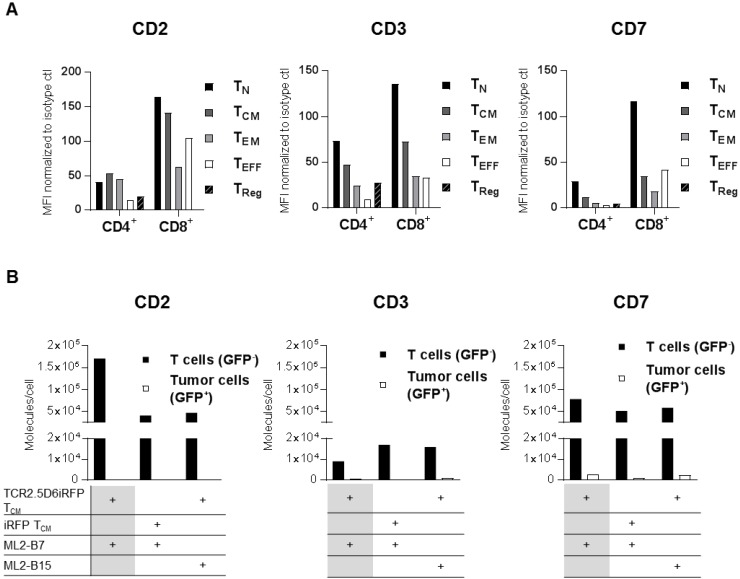
Figure 1.
CD2, CD3, and CD7 are expressed on all T-cell subsets and CD2 as well as CD7 show an upregulation on specifically activated T cells. (A) Analysis of CD2, CD3, and CD7 expression on the surface of different T-cell subsets from freshly isolated peripheral blood mononuclear cells (PBMC). Mean fluorescence intensity (MFI) of PE-labeled anti-CD2, anti-CD3, and anti-CD7 antibodies is shown normalized to PE-isotype control for cells pre-gated on CD4 or CD8. T-cell subpopulations include TCM (central memory T cells; CD45RA-CD62L+), TEFF (effector T cells; CD45RA+CD62L-), TEM (effector memory T cells; CD45RA-CD62L-), TN (naive T cells; CD45RA+CD62L+), and TReg (regulatory T cells; CD4+CD25+CD127low). Analysis of CD2 and CD7 on T-cell subpopulations of two other donors revealed the same pattern for each subset at other MFI values. Flow cytometry data for LSR II was evaluated using FlowJoSoftware7.6.5 and is shown for cells pre-gated on single and 7-AAD- cells. (B) CD2, CD3, and CD7 molecules on the surface of T cells and tumor cells (control). TCR2.5D6iRFP or iRFP TCM (both GFP-) were co-cultivated for 24 h with ML2-B7 or ML2-B15 (both GFP+) tumor cells as indicated and subsequently analyzed for surface expression with respective PE-labeled antibodies. For calculation of the number of surface molecules, detected geometric mean (GM) was related to GM of PE quantification beads and the labeling efficiency of antibodies was determined by nanophotometer.

