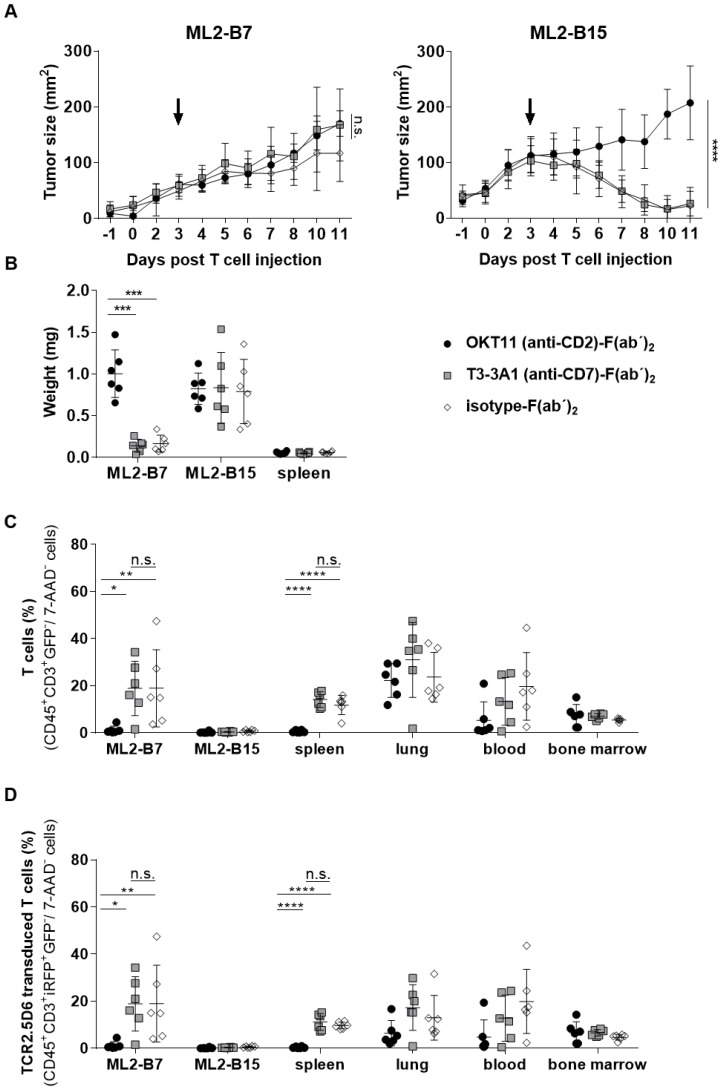
Figure 7.
Injection of OKT11 (anti-CD2)-F(ab´)2, but not T3-3A1 (anti-CD7)-F(ab´)2, impaired T-cell function in vivo. After injection of ML2-B7 tumor cells into the right flank and ML2-B15 tumor cells into the left flank, as well as total body irradiation, mice received 2×10⁷ TCR2.5D6iRFP TCM. Comparable to the imaging experiments, three days after TCM injection, mice received 20 µg of OKT11 (anti-CD2)-F(ab´)2, T3-3A1 (anti-CD7)-F(ab´)2, or isotype-F(ab´)2 (n = 6 for each group). Animals were sacrificed on day 11 after T-cell administration (Figure S1B). Unpaired t-test: * p < 0.05, ** p < 0.01, *** p < 0.001, and **** p < 0.0001. (A) Tumor growth kinetics of ML2-B7 (left side) and ML2-B15 control tumors (right side) for mice injected as indicated. The arrow indicates the time point of respective F(ab´)2 injection. Tumor size is shown in mm2 as mean ± SD over different days post intravenous TCM injection. (B) Weight of tumors and spleen 11 days after TCM injection for mice receiving different F(ab´)2 constructs as indicated. The weight of the organs is shown in milligram as mean ± SD. (C) Percentage of human T cells in indicated organs analyzed by flow cytometry on day 11 post TCM injection. The percentage of CD45+GFP-CD3+ cells of all 7-AAD- cells is depicted as mean ± SD for the indicated groups. (D) The percentage of TCR2.5D6iRFP+ TCM of all 7-AAD- cells in indicated organs is shown as mean ± SD.

