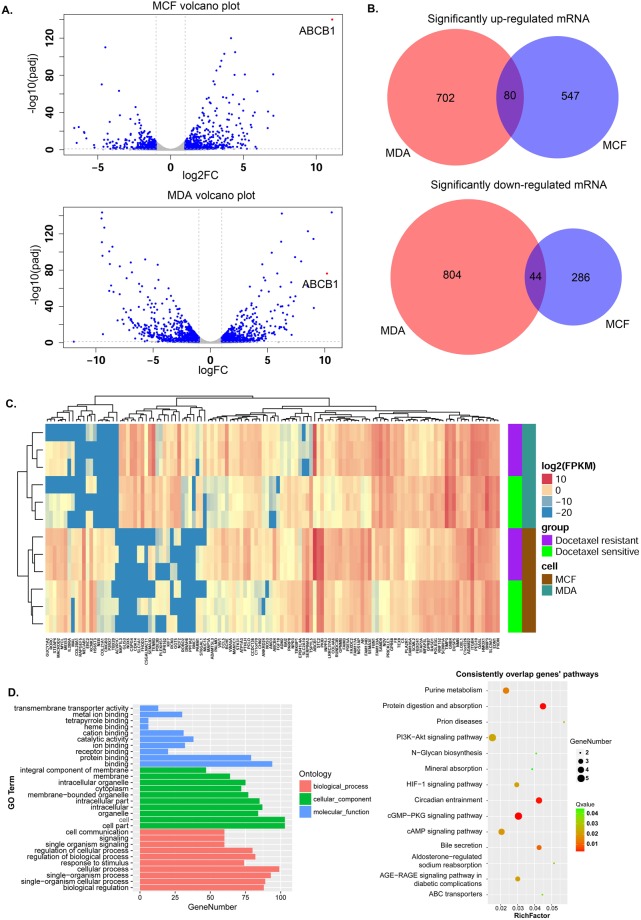
Figure 1.
Overview of the mRNA expression and significantly differentially expressed mRNAs between the parental and docetaxel-resistant cell groups. (A) Volcano figure showing the significantly differentially expressed genes in the MDA-RES and MCF7-RES cells in comparison to their parental cells. The blue dots represent mRNAs with |Log2FC| > 1, FDR < 0.1. (B) Venn diagrams of the significantly up-regulated or down-regulated mRNAs in both of the cells. (C) Complete-linkage clustering with the 124 consistent SDE mRNAs in the 12 samples. D. KEGG pathway enrichment and GO analysis for the consistent SDE genes. Left panel: GO functional classification of the consistent SDE genes. Red, green, and blue represent the three classes of the GO term. The top 10 enriched GO terms are shown in each class. Right panel: Scatter plot for the KEGG enrichment of the consistent SDE genes. RichFactor is the ratio of the consistent SDE genes annotated in a pathway to all the genes in this pathway. The Q value is the corrected p-value. The top 14 pathways with a Q value < 0.05 are shown in the figure.

