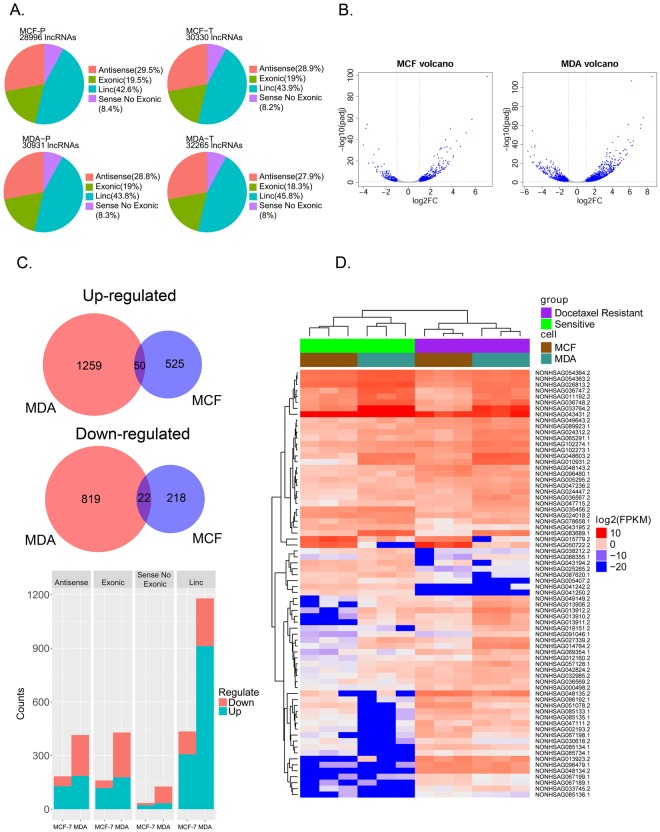
Figure 2.
Overview of the lncRNA expression and significantly differentially expressed lncRNAs between the parental and docetaxel-resistant cell groups. (A) The subgroups and number of lncRNAs detected in the docetaxel-resistant and parental cell lines (P represents the parental cell line; T represents the docetaxel-resistant cell line). (B) Volcano figure showing the significantly differentially expressed lncRNAs in the MDA-RES and MCF7-RES cells compared to their parental cells. The blue dots represent lncRNAs with |Log2FC| > 1, FDR < 0.1. (C) Upper panel: Venn diagrams of consistently up-regulated or down-regulated lncRNAs in both of the MDA-RES and MCF7-RES cells. Lower panel: the bar chat shows the subgroups and numbers of significantly up-regulated or down-regulated lncRNAs. (D) Complete-linkage clustering with the 72 consistent SDE lncRNAs in the 12 samples.

