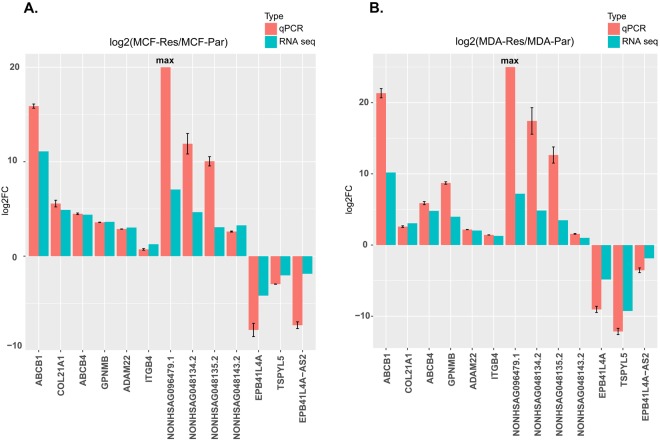
Figure 6.
Real-time qPCR validation of important SDE lncRNAs and mRNAs. Validation of the important SDE lncRNAs and mRNAs in the MCF cells (A) and MDA cells (B). The heights of the red columns represent the logarithmically transformed mean fold-changes between the resistant and parental cells detected by QPCR. Data from three duplications are presented as mean ± standard error. The blue columns represent the logarithmically transformed fold-changes between the resistant and parental groups detected by RNA-seq. ‘Max’ represents an infinitely large number due to the absence of NONHSAG096479.1 in the parental cells.

