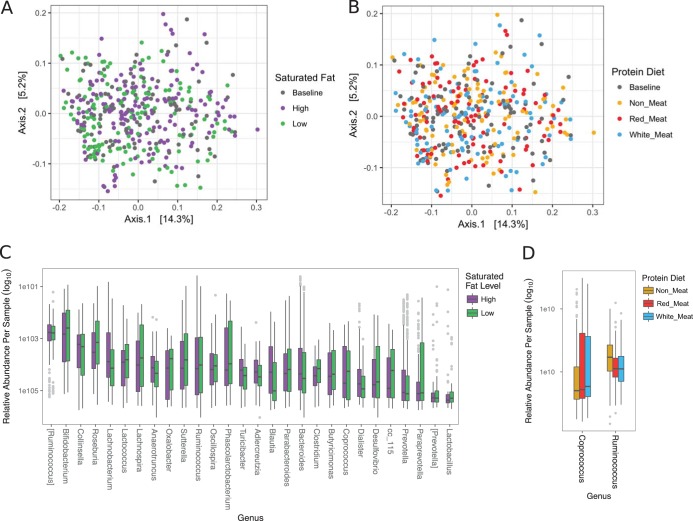
FIG 2.
Overall dietary influence on the microbiome. Unweighted UniFrac PCoA data of fecal samples from 109 participants are labeled by (A) saturated fat level and (B) protein diet. Differentially abundant OTUs between (C) saturated fat level and (D) protein diet were determined by DESeq2 using age, sex, ethnicity, and diet order as covariates. Significant OTUs with P values (Benjamini-Hochberg corrected) that are described at the genus level are displayed as relative abundance within each diet.

