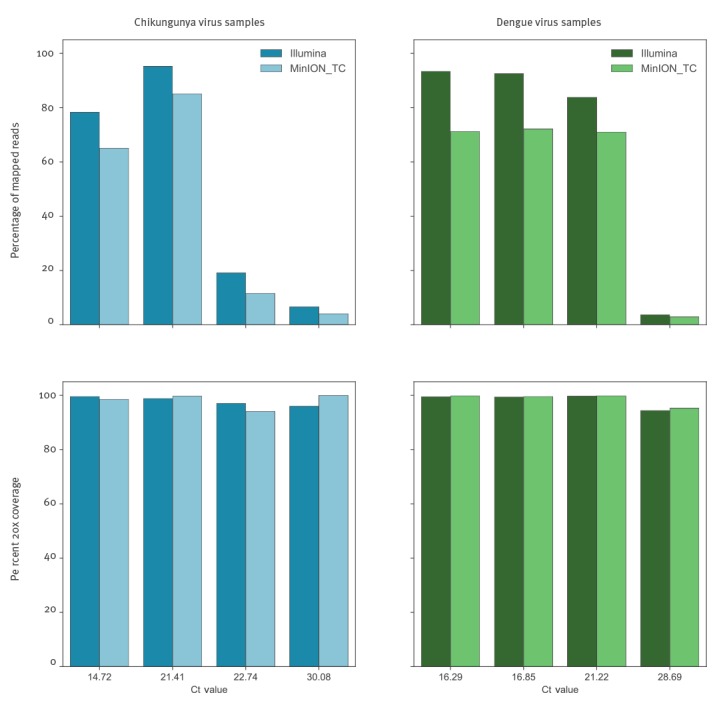
Figure 3.
Comparison of Nanopore and Illumina results, as to proportions of reads mapping to the appropriate reference viral sequence, and proportions of reference genome sequenced at minimum 20-fold coverage, United Kingdom, 2017a (n = 8 samples)
Ct: cycle threshold; TC: template/complement.
a The Nanopore and Illumina data presented in the figure were obtained in 2017 on samples that had been collected and found positive for chikungunya or dengue virus by real-time reverse transcription-PCR in 2016.
The percentage of total reads mapping to the appropriate reference sequence is plotted in the upper panel. Lower panels display the percentage of the reference genome sequenced to a minimum depth of 20-fold in the data generated, in dark blue or dark green for the Illumina sequence data, in light blue or light green for Nanopore data (MinION_TC).