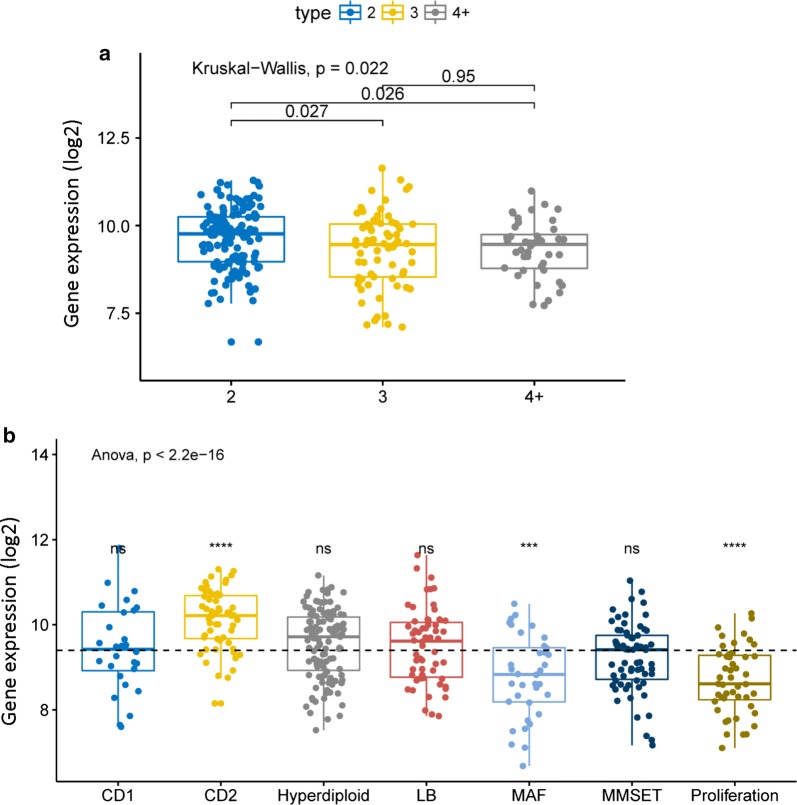
Fig. 1.
The expression of BCAR3 in different amplification levels of 1q21 and 7 molecular subtypes. a BCAR3 expression levels at different amplification levels of 1q21. The X-axis represents the 1q21 amplification, the Y-axis represent BCAR3 expression level. P = 0.022, Kruskal–Wallis test. b Comparison of BCAR3 expression levels in 7 molecular subtypes. The Y-axis represents BCAR3 expression levels; the X-axis represents 7 molecular subtypes. P < 2.2E−16, Anova test. We use statistically significant symbol: ns; P > 0.05; *P < = 0.05; *P < = 0.01; * *P < = 0.001; * * * *P < = 0.0001

