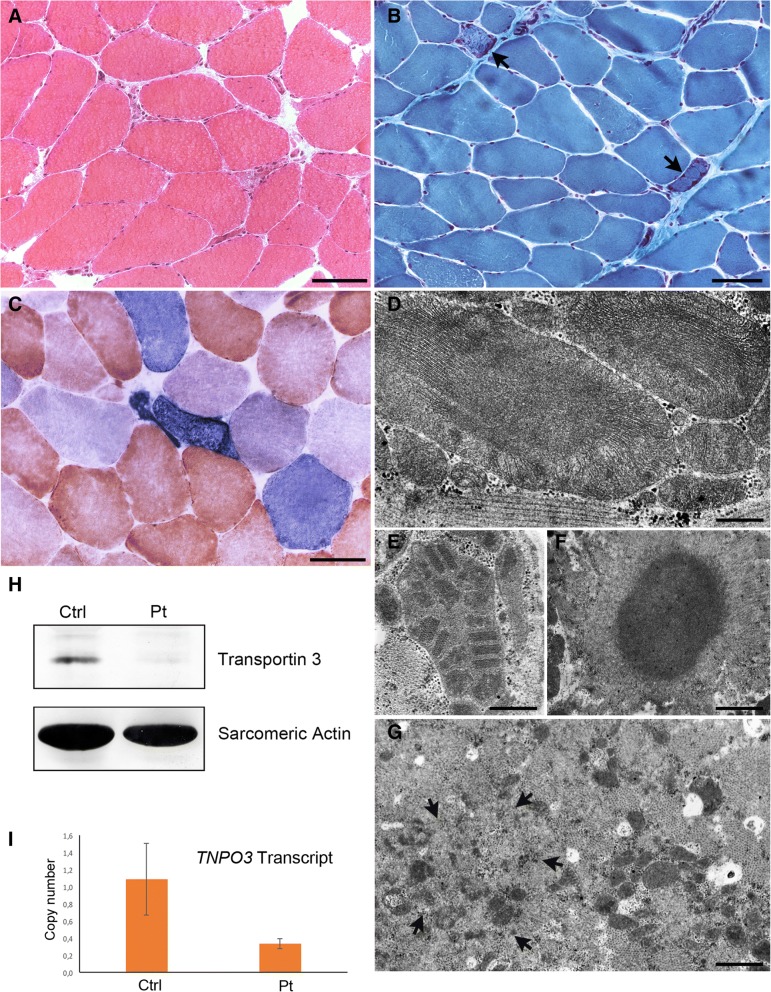
Fig. 2.
(a) h & e, (b) Gomori Trichrome and (c) COX/SDH staining showing, in the first biopsy (a), a few atrophic degenerating fibres, and, in the second biopsy (b, c), ragged red-like fibres (arrows), some of which appear intensely positive to SDH (COX-positive fibres stain brown, while COX-deficient fibres stain blue due to preserved SDH activity). Bars = 50 μm. (d-g) Electron microscopy images of first (d) and second biopsy (e-g) showing mitochondria of abnormally large size containing densely packed cristae (D) or paracrystalline inclusions (e), a cytoplasmic body (f), and myofibrillar disorganization (arrows) (g). Bar G = 250 nm; E = 500 nm; F,G = 1 μm. h Western blot showing reduced intensity of the transportin 3 band; (i) Real time PCR showing decreased TNPO3 transcript levels

