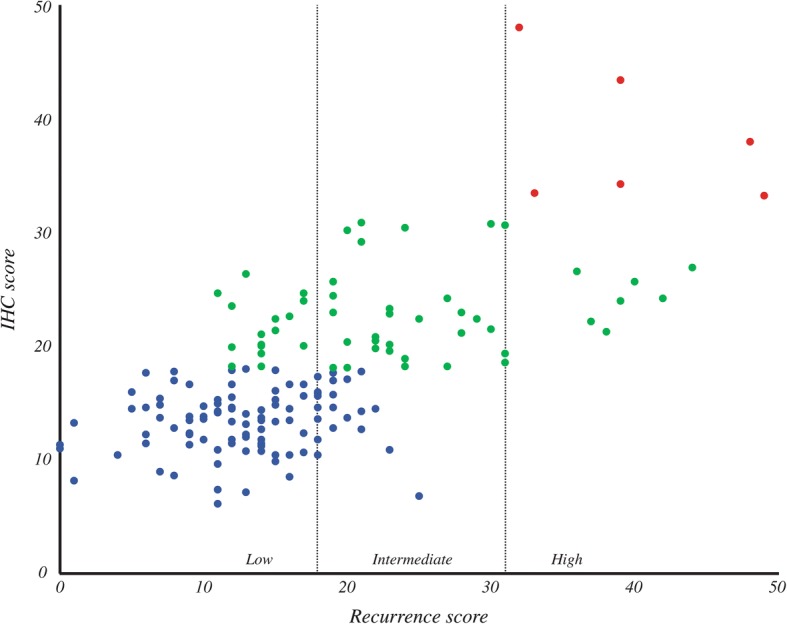
Fig. 3.

Estimation of RS from IHC. The RS for each sample is represented on the x-axis. The IHC scores generated by linear regression, following data transformation and the addition of BCL-2, are represented on the y-axis. Dotted lines represent the categorical boundaries that distinguish low, intermediate, and high risks of recurrence. The category to which each sample is assigned based on IHC score is indicated by color; blue = low, green = intermediate, red = high
