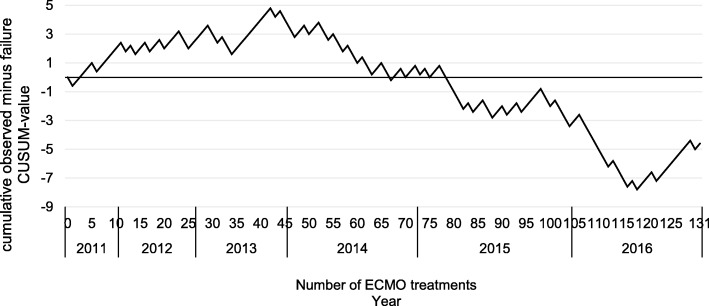
Fig. 1.
Cumulative observed minus failure (CUSUM) chart for in-hospital mortality after ECMO treatment. Legend: the vertical axis shows the CUSUM value, which increases for each failure or decreases on each success. The horizontal axis shows the number of ECMO treatments and the corresponding year. Expected failure rate was set at the expected mortality rate of 60% based on the data of the epidemiologic study of Karagiannidis et al. for a mixed vv- and va-ECMO population in Germany [5]. An upward slope represents a failure rate higher than expected and a downward slope represents a failure rate fewer than expected. With a failure rate equal the expected failure rate, the CUSUM curve should oscillate around a horizontal axis

