Fig. 4.

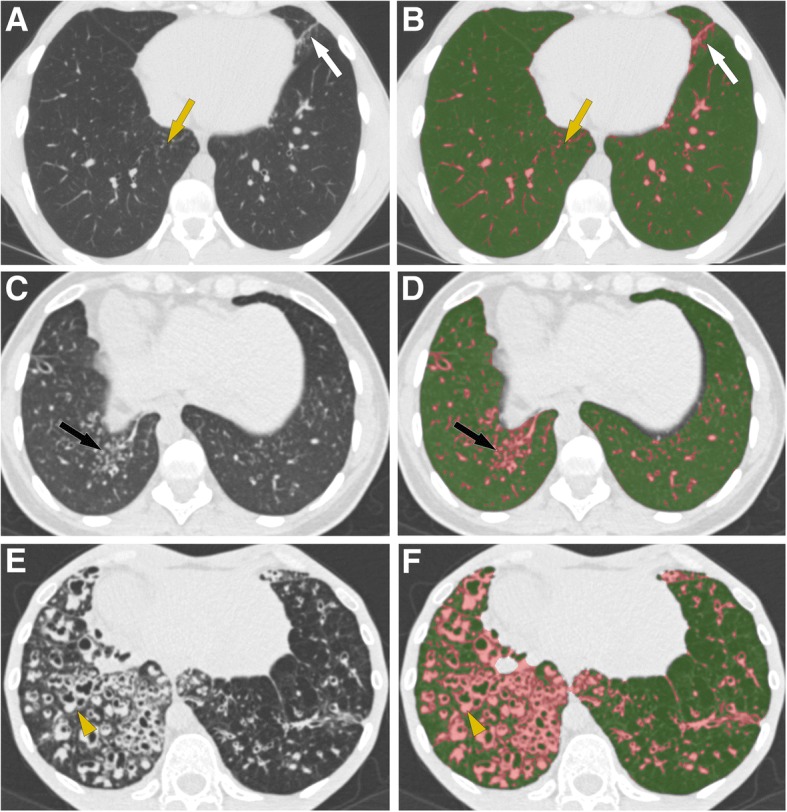
CT-density scores in patients with increasing disease severity. Areas of high attenuation, using MLD + 1SD as threshold, are tagged in pink. a, b Patient with mild lung involvement (FEV1 = 80%, CT score = 6.01): (a) Small areas of tree-in-bud (yellow arrow) and subsegmental atelectasis (white arrow) are seen on the native axial image. b Post-processed image, illustrating that these PCD-related abnormalities appear in pink, along with pulmonary vessels. c, d Patient with moderate lung involvement (FEV1 = 60%, CT score = 8.37): areas of tree-in-bud (black arrow) seen on the native axial CT image (c) are more extensive and are pink-colored on the post-processed image (d) (e, f) Patient with severe lung involvement (FEV1 = 25%, CT score = 13.72): (e) Visually, bronchial abnormalities (yellow arrowhead) predominantly affect the right lung on the native axial CT image. f Post-processed CT image. The CT-density score is 17.59 for the right lung and 10.87 for the left lung
