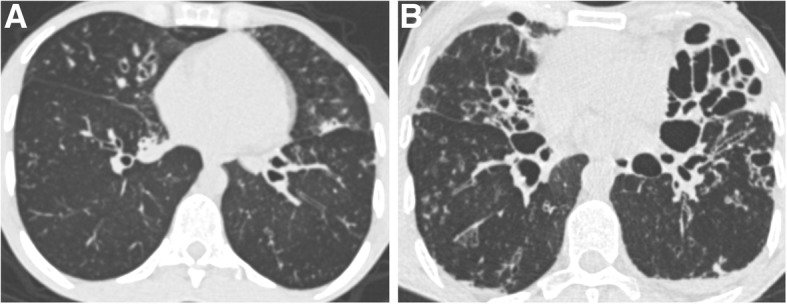
Fig. 5.

Different imaging features in patients with similar FEV1 values. a Patient with FEV1 = 38% predicted and moderate bronchiectasis predominantly affecting the middle lobe. The CT-density score based on MLD + 1SD was 7.79. b Patient with FEV1 = 38% predicted but much more severe bronchiectasis on visual assessment, especially in the lingula. The CT-density score based on MLD + 1SD was 12.75. These two examples show that CT imaging provides additional information to spirometry, especially regarding regional disease distribution (homogeneous versus heterogeneous), and the severity of bronchiectasis, which correspond to irreversible changes
