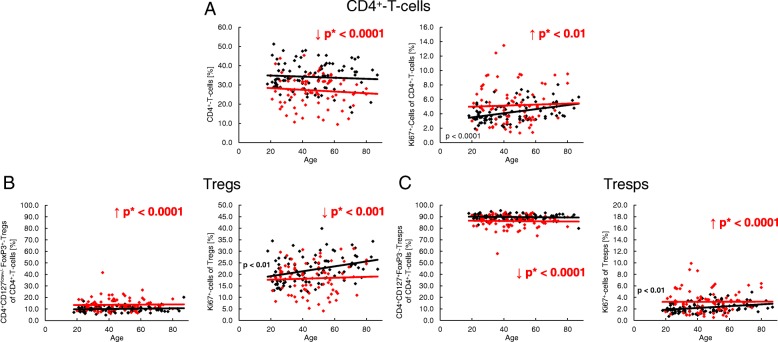
Fig. 2.
The proportion of Ki67+ cells of CD4+ T cells, total CD4+CD127low+/–FoxP3+ regulatory T cells (Tregs) and total CD4+CD127+FoxP3− responder T cells (Tresps) during the life course in healthy volunteers (n = 94) and SLE patients (n = 78). The percentages of CD4+ T cells within PBMCs (a), and of total Tregs (b) or total Tresps (c) within the total CD4+ T-helper cell pool, as well as their Ki67 expression, are shown for healthy volunteers (black diamonds) and SLE patients (red diamonds) during the course of life. The figures present the regression lines concerning the changes in the percentages of the individual T-cell subsets together with their Ki67 expression with increasing age. Significant age-dependent changes in healthy volunteers are marked by black p values. Significant age-independent differences between healthy volunteers and SLE patients are marked by red arrows (red downward and upward arrows) and red p* values

