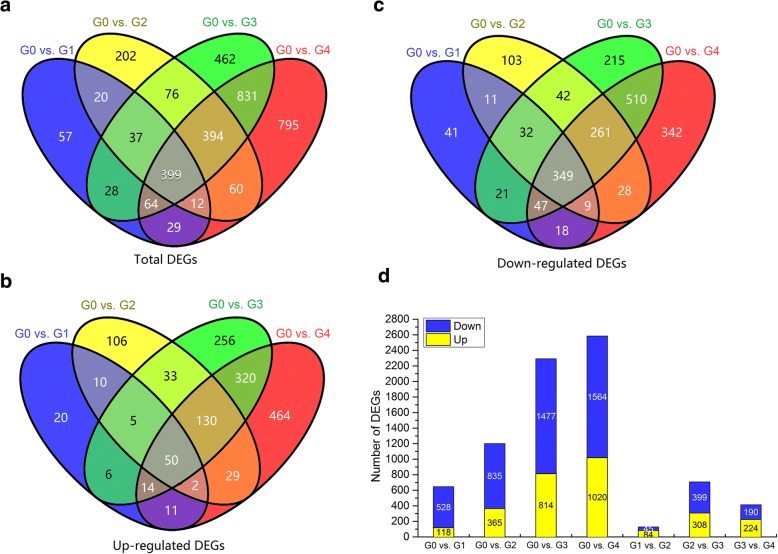
Fig. 2.
Summary of the number of differentially expressed genes (DEGs) identified by RNA-seq analysis in the fruit skin tissues of ‘Red Delicious’ and its four generation mutants (‘Starking Red’, ‘Starkrimson’, ‘Campbell Redchief’ and ‘Vallee spur’) at S2, named G0 to G4. The number of total DEGs (a), up-regulated DEGs (b), and down-regulated DEGs (c) are presented by Venn diagrams (FDR < 0.01 and fold change ≥ 2). d, Number of total up-regulated and down-regulated DEGs. The histogram represents the number of commonly down-regulated (blue) and up-regulated (yellow) DEGs

