
Fig. 2.
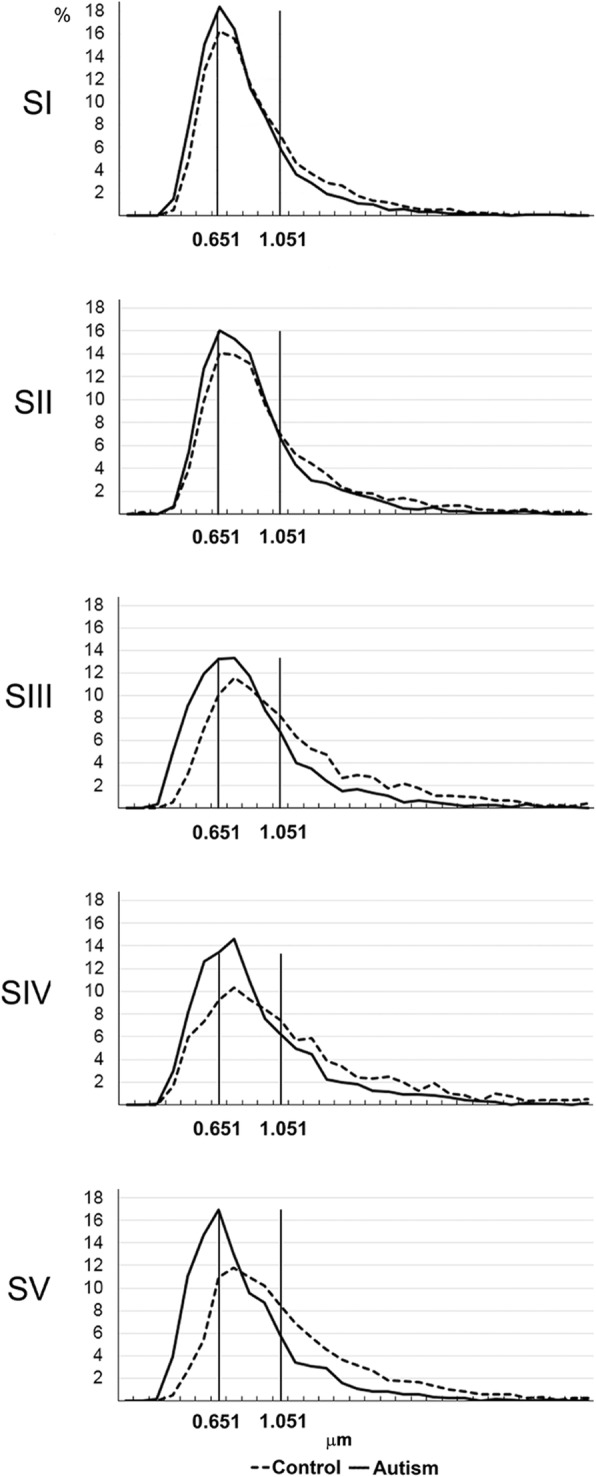
Differences between axon diameter distribution in autism and control. The distribution curves of axon diameter in all five CC segments in autistic and control subjects revealed a higher percentage of small-diameter axons and a lower percentage of large-diameter axons in autistic subjects, with more prominent differences in posterior S III– S V than in anterior S I and S II