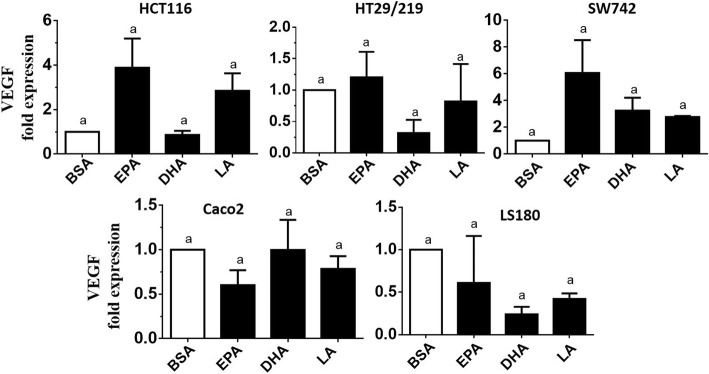
Fig. 3.
Comparison of the relative expression of VEGF in PUFA-treated and control cells, measured by quantitative real-time-PCR. Expression of VEGF was normalized to GAPDH. BSA-treated cells were used as a control and expressions in all other PUFA-treated cells were expressed as an n-fold difference relative to controls (BSA). Mean values ± SD of the three experiments are given, and data are verified by Tukey’s honestly significant difference multiple comparison test (p > 0·05). EPA, eicosapentaenoic acid; LA, linoleic acid; DHA, docosahexaenoic acid; BSA, bovine serum albumin

