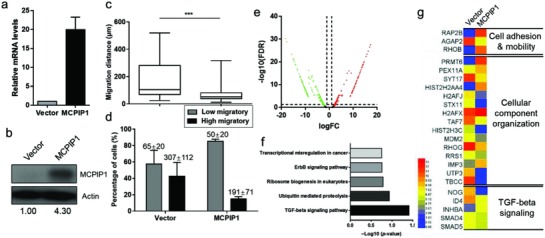
Figure 3.

MCPIP1 reduces single‐cell migration and suppresses TGF‐β signaling. a) qRT‐PCR analysis of MCPIP1 mRNA level in MDA‐MB‐231/Vector and MDA‐MB‐231/MCPIP1 cells. b) Western‐blot analysis of MCPIP1 protein level in MDA‐MB‐231/Vector and MDA‐MB‐231/MCPIP1 cells. Comparison of the migration distances. c) Percentage of high‐migratory versus low‐migratory cells (mean ± SD is shown in corresponding bar plots to represent the results). d) For MDA‐MB‐231/Vector and MDA‐MB‐231/MCPIP1 cells. e) Volcano plot of differentially expressed gene between MDA‐MB‐231/Vector and MDA‐MB‐231/MCPIP1 cells. The red dots represent up‐regulation genes and the green dots represent down‐regulation genes. f) Enriched KEGG pathways in gene correlation among MCPIP1 overexpression cells. g) Heat map for mRNA related to cell migration and TGF‐β signaling between MDA‐MB‐231/Vector and MDA‐MB‐231/MCPIP1 cells.
