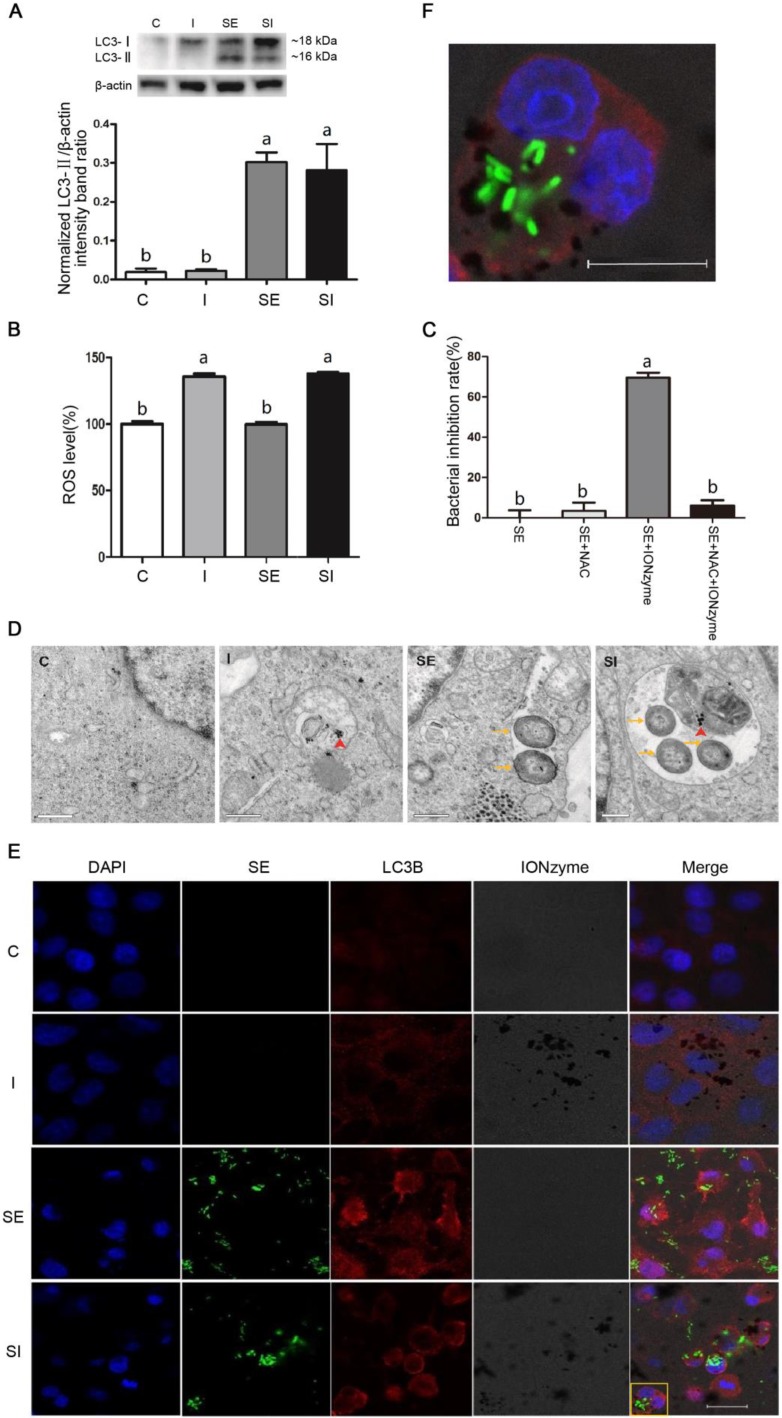
Figure 2.
Effects of IONzymes on LMH cells infected with S. Enteritidis. (A) The protein expression levels of LC3, a marker protein for autophagy, in LMH cells at 12 h. (B) The relative levels of ROS in LMH cells. (C) The antibacterial effects of NAC and IONzymes in intracellular S. Enteritidis at 12 h. (D) TEM micrographs of co-localization of IONzymes with S. Enteritidis and autophagosomes in LMH cells at 12 h. The red short triangle arrows show the IONzymes, and the yellow arrows show the S. Enteritidis. Scale bar: 0.5 μm. (E) Representative immunostaining image for IONzymes (black), S. Enteritidis (green), LMH cell nuclei (blue) and autophagosomes (LC3B, red) in LMH cells at 12 h. Scale bar: 20 μm. (F) The enlarged image of yellow delineate highlighting the co-localization of above four substances in Figure 2E. The scale bar in the figure represents 10 μm. For figure A, B and D-F, cells were treated with vehicle control (C), IONzymes alone (I), infected with S. Enteritidis in the absence (SE) or presence (SI) of IONzymes. For figure C, S. Enteritidis infected LMH cells were treated with or without NAC and IONzymes. Values represent the Mean ± SEM (n=3). Different capital letters indicate statistically significant difference (P < 0.05).

