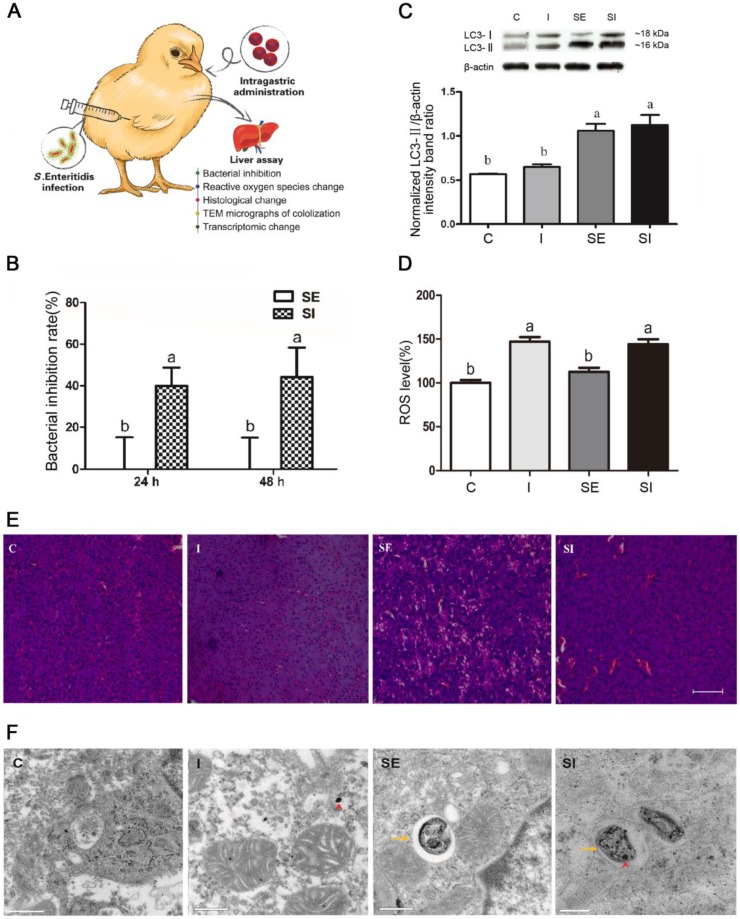
Figure 3.
Effects of IONzymes in chickens infected with S. Enteritidis. Chickens were treated with vehicle control (C), IONzymes alone (I), infected with S. Enteritidis in the absence (SE) or presence (SI) of IONzymes. (A) Schematic illustration of the animal experiment. Chicken were orally gavaged with IONzymes and subcutaneous injected with S. Enteritidis. Livers were collected for pathological analyses. (B) Bacterial inhibition rates of IONzymes at different times in livers of S. Enteritidis infected chickens. Values represent the Mean ± SEM (n=9). Different letters indicate statistically significant difference (P < 0.05). (C) The hepatic LC3 protein expression levels in the chickens from the treatment groups. Representative images (top) and quantitative analysis (bottom) showing the effect of treatments on LC3 protein levels. The values represent the Mean ± SEM (n=3). Different letters indicate statistically significant difference (P < 0.05). (D) The relative levels of ROS in chickens. Values represent the Mean ± SEM (n=6). Different capital letters indicate statistically significant difference (P < 0.05). (E) Representative photomicrographs of the liver histological section of birds exposed to IONzymes in the absence or presence of S. Enteritidis administration. Scale bar: 50 μm. (F) TEM micrographs of co-localization of IONzymes with S. Enteritidis and autophagosomes in liver of chickens. The red short triangle arrows show the IONzymes, and the yellow arrows show the S. Enteritidis. Scale bar: 0.5 μm (in C, I, SE) and 0.2 μm (SI).

