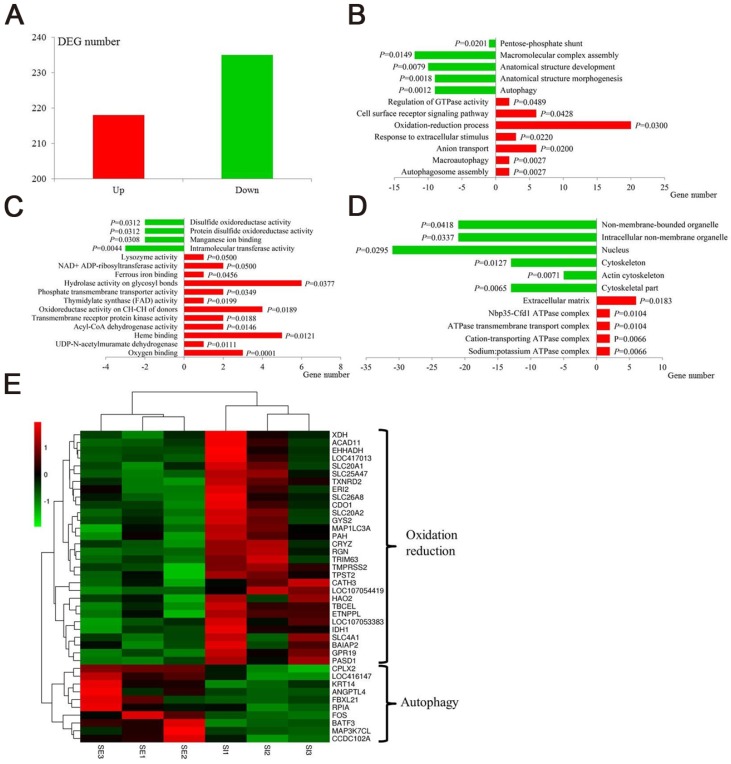
Figure 4.
Transcriptomic effect of IONzymes in chickens infected with S. Enteritidis. Chickens were infected with S. Enteritidis in the absence (SE) or presence (SI) of IONzymes. (A) Number of upregulated and downregulated differentially expressed genes (DEGs) in group SI compared with group SE. Main gene ontology (GO) categories, including biological process (B), molecular function (C) and cellular component (D), of the DEGs in group SI compared with group SE respectively. Green and red columns represent downregulated and upregulated GO terms respectively. Abscissa axis represents number of DEGs in each GO term. P value beside the columns represents enrichment significance of DEGs. (E) Heatmap of DEGs in the oxidation reduction and autophagy pathways between group SI and group SE. Rows indicate gene expression of DEGs in the oxidation reduction and autophagy pathways; columns represent individual samples from two groups. Red represents upregulation, black indicates insignificant change, and green represents downregulated expression.

