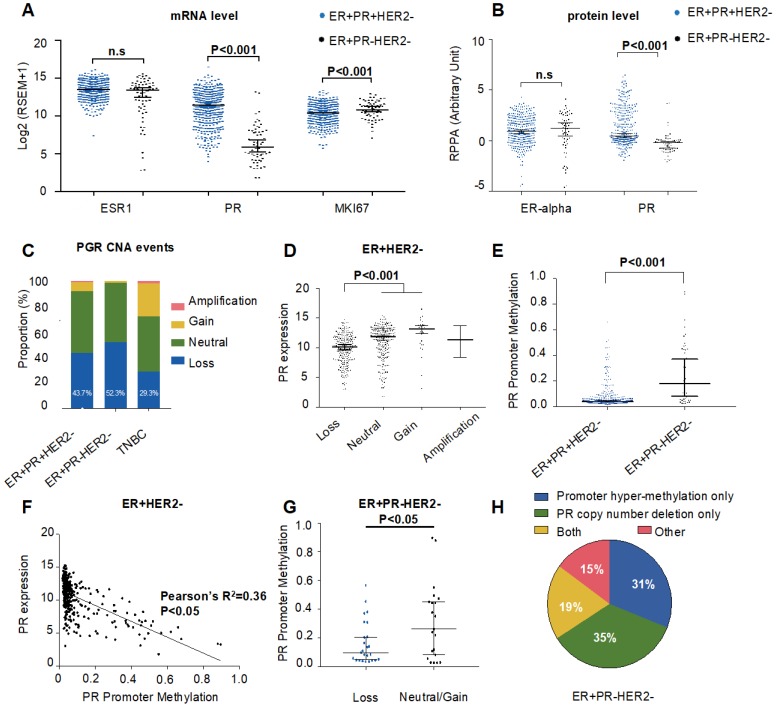
Figure 2.
Genomic and epigenomic causes of progesterone receptor (PR) loss within ER+HER2- breast cancer from the TCGA cohort. (A) Log2-transformed mRNA expression levels (RSEM) of ESR1, PR and MKI67. P-value was calculated by the Mann-Whitney test. Median with 95% confidence intervals (CI) is displayed. (B) Protein expression levels by reverse phase protein array (RPPA) of ER-alpha and PR. P-value was calculated by the Mann-Whitney test. Median with 95% CI is displayed. (C) Somatic copy number alteration (SCNA) status of PR among the ER+PR-HER2-, ER+PR+HER2- and TNBC groups. Loss: hemizygous or homozygous deletion; amplification: high-level amplification. The rate of PR copy number loss in each group is displayed (P=0.23 between ER+PR+HER2- and ER+PR-HER2- groups). (D) PR mRNA expression level by different PR copy number status within ER+PR- breast cancer. The mRNA expression value was calculated as log2(RSEM+1). The P-value was calculated by the Mann-Whitney test. Median with 95% CI is displayed. (E) PR promoter methylation levels between ER+PR-HER2- and ER+PR+HER2- breast cancer. The promoter methylation probe for PR was cg01671895. The P-value was calculated by the Mann-Whitney test. Median with 95% CI is displayed. (F) Correlation analysis between PR promoter methylation levels and mRNA expression levels by Pearson's correlation test (r=-0.6, R2=0.36, P<0.05). (G) PR promoter methylation levels between the PR copy loss group and the neutral/gain group in ER+PR-HER2- breast cancer. The P-value was calculated by the Mann-Whitney test. Median with 95% CI is displayed. (H) Pie chart summary of PR loss causes from the ER+PR-HER2- breast cancer group. Promoter hypermethylation was defined as “β-value > 0.2”.

