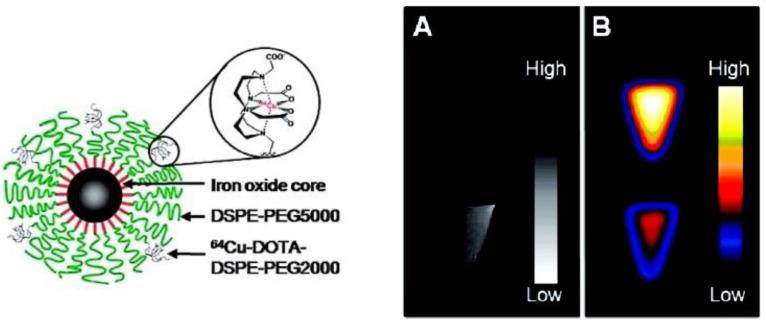
Figure 4.
(Left) Schematic representation of dual-modality 64Cu-mSPIO. (Right) PET and MR imaging of 64Cu-mSPIO phantoms. (A) T2-weighted image of 25 µg Fe/mL (bottom) of 64Cu-labeled magnetic nanoparticles (scale bar corresponds to high and low iron concentration). (B) Decay-corrected microPET image of 25 µg Fe/mL (top) and 10 µg Fe/mL (bottom) of 64Cu-labeled magnetic nanoparticles (scale bar corresponds to high and low copper-64 concentration). Adapted with permission from 33, copyright 2010 American Chemical Society.

