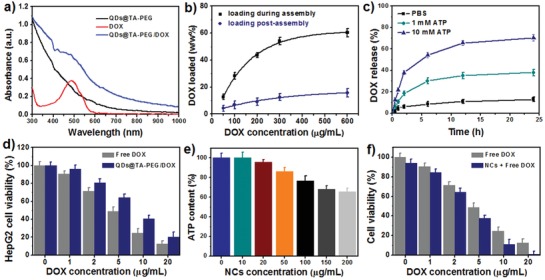
Figure 3.

a) UV–vis–NIR absorbance spectra of QDs@TA‐PEG, DOX and QDs@TA‐PEG/DOX. b) The DOX‐loading capability of QDs@TA‐PEG NCs under various DOX feeding amounts and different loading manner. c) Time evolution of DOX release profiles of QDs@TA‐PEG/DOX under different conditions. d) Relative HepG2 cell viability after treating with QDs@TA‐PEG/DOX or free DOX for 24 h. e) ATP contents in HepG2 cells cultured with different concentrations of the NCs for 24 h. f) HepG2 cell viability after the treatment of different dosages of DOX plus 100 µg mL−1 NCs for 24 h.
