
Figure 3.
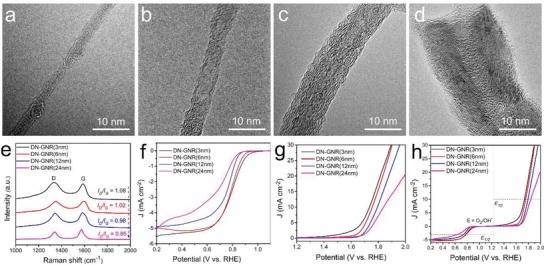
a–d) TEM images and e) Raman spectra of different width of DN‐GNR range from 3 to 24 nm. f) ORR and g) OER polarization curves, and h) the overall polarization curves of different width of DN‐GNRs.
Official websites use .gov
A
.gov website belongs to an official
government organization in the United States.
Secure .gov websites use HTTPS
A lock (
) or https:// means you've safely
connected to the .gov website. Share sensitive
information only on official, secure websites.
a–d) TEM images and e) Raman spectra of different width of DN‐GNR range from 3 to 24 nm. f) ORR and g) OER polarization curves, and h) the overall polarization curves of different width of DN‐GNRs.