Figure 3.

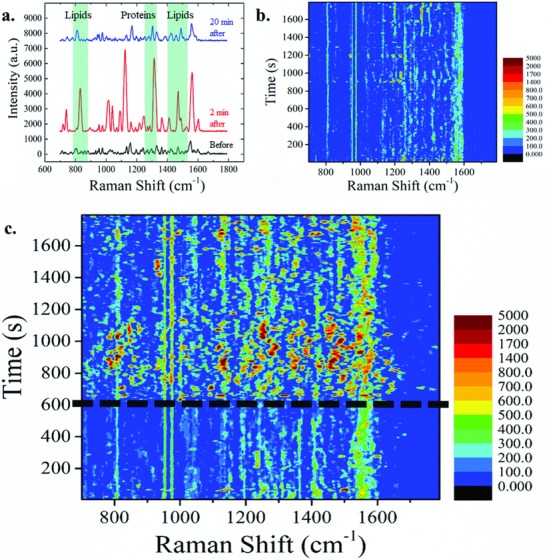
a) Enhanced Raman spectra recorded from the same 3D plasmonic nanoelectrode before (black), 2 min after (red), and 20 min after (blue) the application of the electroporation pulse train. Three regions of the Raman shift are highlighted in which most of the peaks are related to lipids and proteins. The background has been subtracted and the intensities coherently shifted to improve the visualization. Data are from a single experiment. b,c) Colored maps of the average SERS signals of cells lying on top of 3D plasmonic nanoelectrodes excited by a λ = 785 nm laser during 30 min of acquisition. b) The spectra do not show particular features or changes in time when there are no external stimuli applied. c) Average SERS signals of electroporated samples at 10 min from the beginning of the experiments. After electroporation (at t = 600 s, marked by the dotted line), new vibrational modes appear, and the average peaks intensities increase. Rapid shifts of new and old peaks occur, meaning that the plasma membrane and the rest of the cell undergo rearrangement. Slowly over time, the signals come back to resemble the signal before the electroporation occurred.
