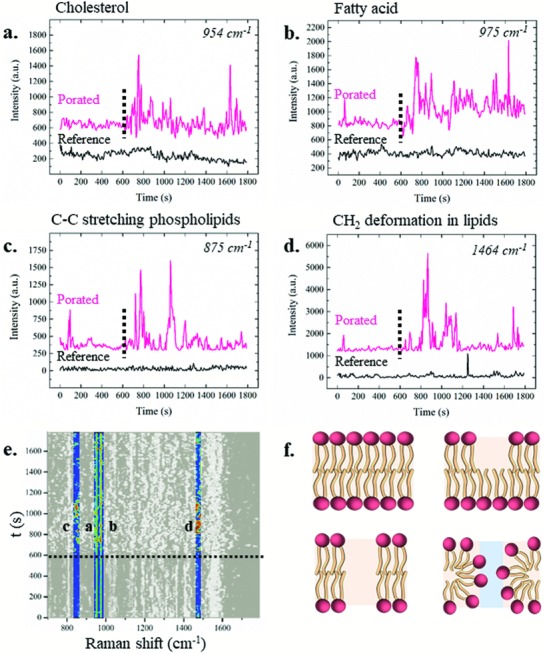
Figure 4.

a–d) Average temporal behaviors of lipid related peaks throughout the 30 min of experiments in the absence (black) and in the presence (pink) of the electroporation, which is identified by the dotted line. The peak dynamics are shown on the average spectra. In particular, the dynamics of the a) 954 cm−1 peak assigned to cholesterol, b) 975 cm−1 peak assigned to fatty acid, c) 875 cm−1 peak assigned to the C—C stretching of phospholipids, and d) 1464 cm−1 peak assigned to CH2\CH3 deformations in cholesterol and triacylglycerols. e) Highlighted peaks from the global colored map of electroporated samples. Scale bar from 0 a.u. (black) to 5000 a.u. (red). f) Sketches of possible lipid membrane configurations. Top left: intact lipid bilayer, top right and bottom left: hydrophobic pores in the cell membrane, bottom right: hydrophilic pore.
