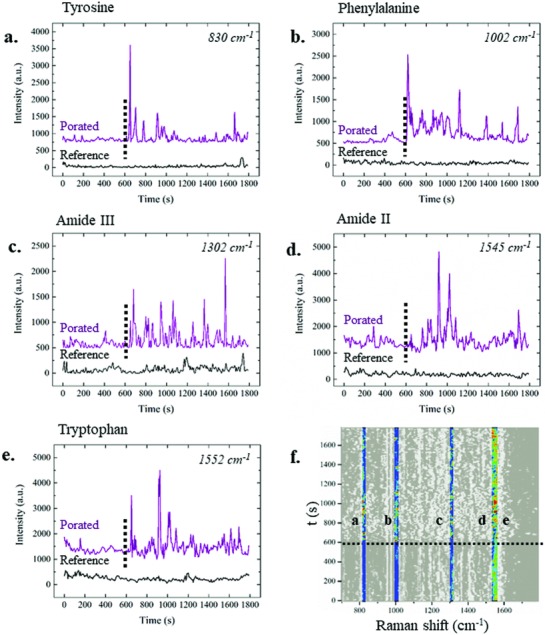
Figure 5.

Average temporal behaviors of protein‐related peaks throughout the 30 min of experiments in the absence (black) and in the presence (purple) of electroporation, identified by the dotted line. The peak dynamics are shown on the average spectra. In particular, dynamics of the a) 830 cm−1 peak, associated with the tyrosine amino acid, b) 1002 cm−1 peak assigned to phenylalanine, c) 1302 cm−1 peak that identifies the amide III vibrational mode, d) 1545 cm−1 peak assigned to the amide II vibrational mode, and e) 1552 cm−1 peak, assigned to the tryptophan amino acid. f) Highlighted peaks from the colored average map. Scale bar from 0 a.u. (black) to 5000 a.u. (red).
