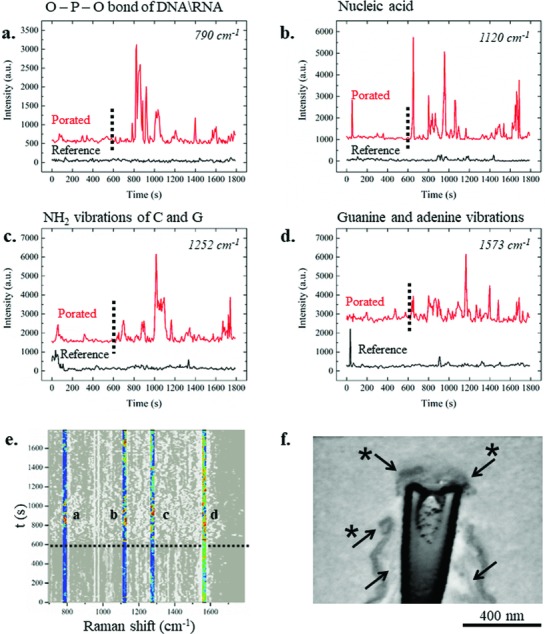
Figure 6.

Average dynamic behavior in time of DNA‐ and nucleic acid‐associated peaks. a) 790 cm−1 peak associated with the O—P—O stretching of DNA and RNA backbone, b) vibrational mode assigned to nucleic acid at 1120 cm−1, c) peak centered at 1252 cm−1 associated with vibration of cytosine and guanine, and d) peak at 1573 cm−1 related to guanine and adenine vibrational modes. Red spectra are the average of electroporated samples at 600 s (dotted line), while black spectra are the reference to which electroporation has not been applied. e) Highlighted peaks from the global colored map that indicated electroporation. Scale bar from 0 a.u. (black) to 5000 a.u. (red). f) SEM cross section (with inverted colors) of a 3D plasmonic nanoelectrode tip with a cell grown on it. The sample was fixed and analyzed after the application of electroporation. The starred arrows indicate the nuclear envelop, clearly broken close to the edge of the 3D nanostructure. The arrows without the star indicate the plasma membrane.
