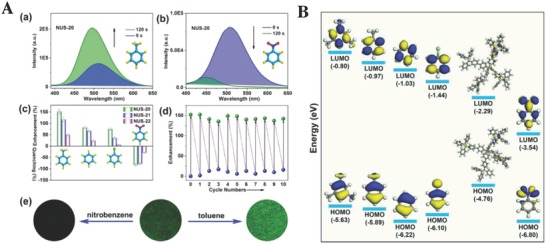
Figure 7.

A) Fluorescence emission spectra of NUS‐20 before and after exposure to a) toluene vapor or b) nitrobenzene vapor for 2 min. c) Percentage of fluorescence enhancement or quenching after exposing POFs to different arene vapors for 2 min at 298 K. d) Cycling test of NUS‐20 for the chemical sensing of toluene vapor. e) Fluorescence microscopy images of NUS‐20 before (middle) and after exposure to nitrobenzene (left) or toluene (right) vapors (λex = 365 nm). B) HOMO–LUMO energy profiles of mesitylene, toluene, benzene, chlorobenzene, NUS‐20 fragment, and nitrobenzene (from left to right). The difference in the LUMO energy state between NUS‐20 fragment and various VOC analytes [ΔE LUMO = E LUMO (arene vapors) – E LUMO (NUS‐20)] is 1.49, 1.32, 1.26, 0.85, and −1.25 eV for mesitylene, toluene, benzene, chlorobenzene, and nitrobenzene, respectively. Adapted with permission.67 Copyright 2016, American Chemical Society.
