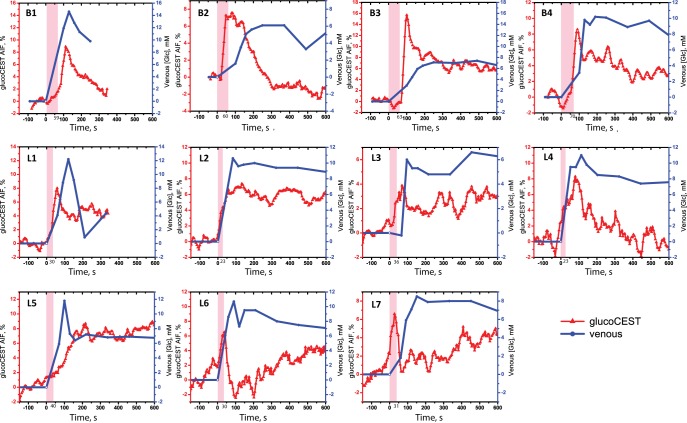
Figure 1.
Comparison of the arterial input function (AIFs) from dynamic glucose-enhanced (DGE) imaging (red) with the sampled venous plasma blood glucose levels (blue) for all volunteers from Baltimore (B1–B4) and Lund (L1–L7). The pink-shaded area shows the glucose infusion period. Notice the different vertical scales used to maximize the visualization of the shape.

