
Figure 2.
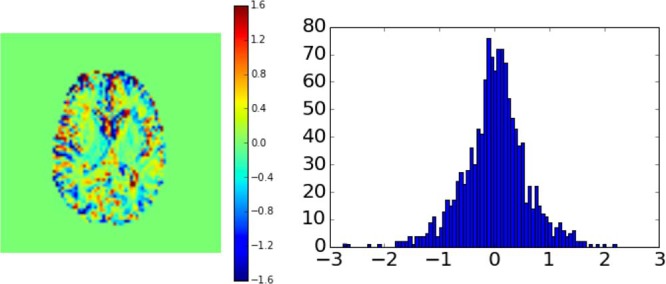
Area under the curve (AUC) image from 1 volunteer together with the values of the individual AUC voxels plotted in a histogram. The image is calculated using the first 5-minute images after start of injection. The color scale bar corresponds to relative signal difference in percent.