. 2018 Nov 3;15(6):473–483. doi: 10.21873/cgp.20106

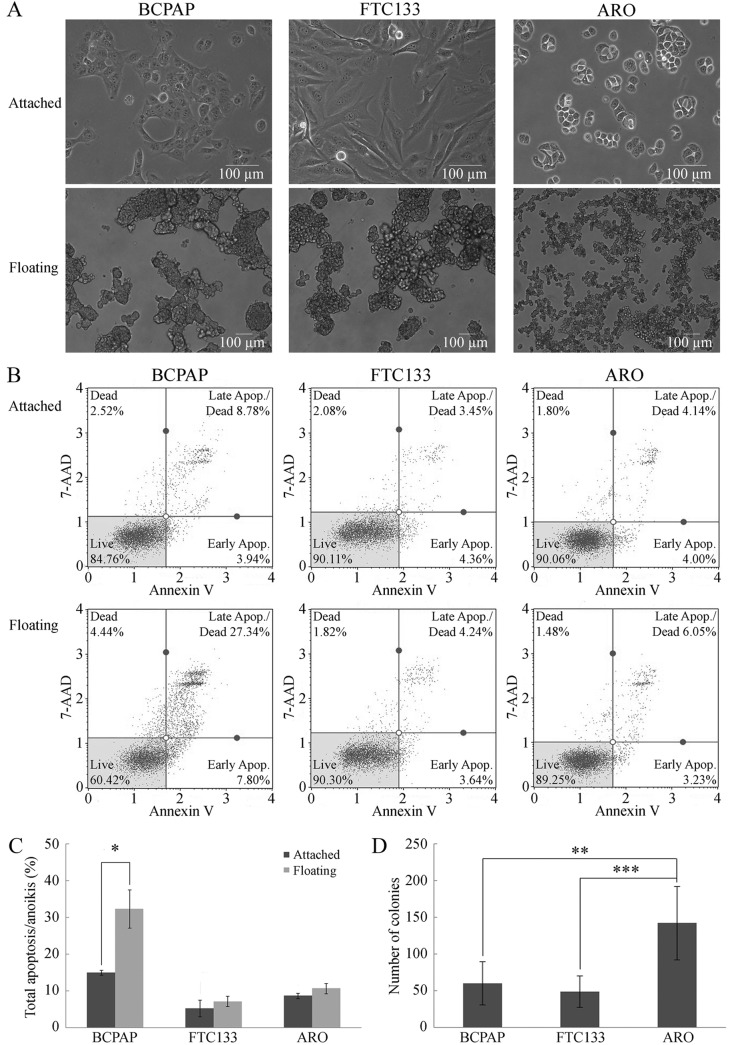
Figure 1. Properties of anoikis resistance in thyroid cancer cell lines. A: Cell morphology of thyroid cancer cell lines: BCPAP, FTC133 and ARO cells. Micrographs were taken under magnification of 200× (attached cells) or 100× (floating cells), using a phase-contrast inverted microscope. B: Representative flow cytometric results of apoptosis/anoikis in BCPAP, FTC133 and ARO cells when cultured under attached (top paneI) and floating (bottom panel) conditions, respectively. C: Percentage total apoptosis/anoikis from flow cytometric analysis from three biological replicates. Data are the mean±S.D. Comparisons were analyzed using the Student’s t-test. D: Anchorageindependent growth measured using soft-agar assay represented by colony numbers from six biological replicates. Data are the mean±S.D. Comparisons were analyzed using ANOVA with Tukey’s post-hoc test. Significantly different at *p≤0.05, **p≤0.01, and ***p≤0.001. 7AAD: annexin V and 7-aminoactinomycin D.

Figure 1