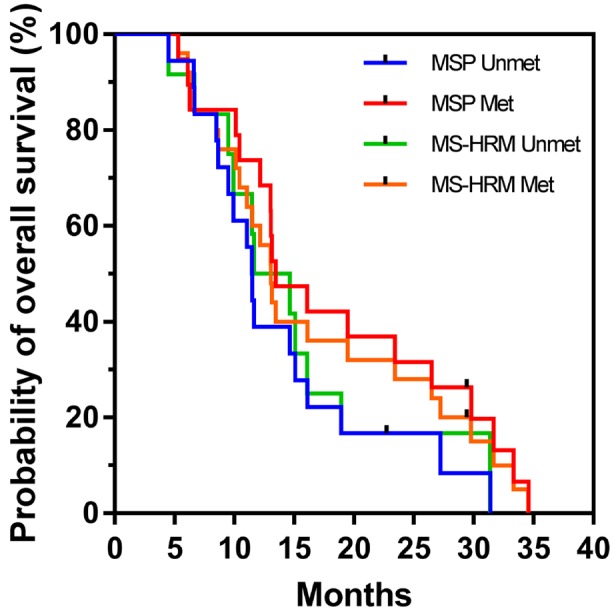
Figure 3. Kaplan–Meier plot of overall survival according to methylation, comparing methylation-specific polymerase chain reaction (MSP) and methylation-sensitive high-resolution melting analysis (MSHRM) when N=37. Log-rank p-values were 0.096 and 0.482 for MSP and MS-HRM, respectively.

