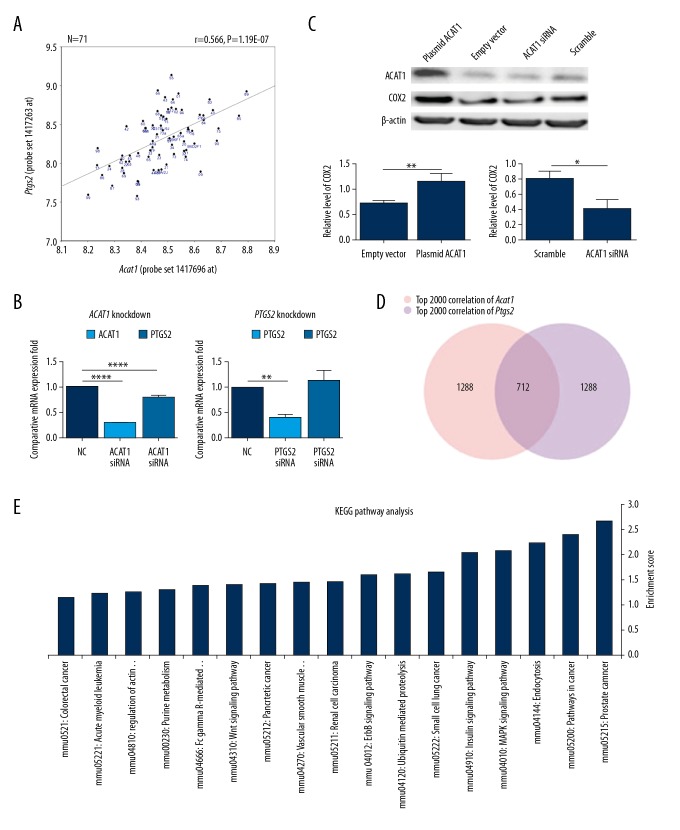
Figure 4.
Correlation analysis and the expression regulation validation between Acat1 and Ptgs2. (A) Correlation Matrix analysis for Acat1 and Ptgs2 expression in BXD RI mouse hippocampus (n=71). X axis and Y axis denoted Acat1 and Ptgs2 expression, respectively. Digitally labeled dots denote the 69 strains of BXD RI mice and parental strains (C57BL/6J and DBA/2J). P=1.19E-07. (B) QPCR was performed to detect the contribution of ACAT1_siRNA to Ptgs2 expression variation (B, left) and PTGS2_siRNA treatment to ACAT1 expression variation (B, right) in human SH-SY5Y cells. (C) Western Blot analysis was performed to detect COX2 protein changes after silencing or overexpressing ACAT1. (*** P<0.001, ** P<0.01 and * P<0.05). (D) The top 2000 correlated genes for both Acat1 andPtgs2 in BXD RI mouse hippocampus were collected, and 712 genes were collected as the common co-variations with both genes through VENN analysis. Pink and purple cycles denote numbers of highly correlated genes with Acat1 or Ptgs2, respectively. (E) KEGG pathway analysis revealed 17 significant enrichment pathways; X-axis and Y-axis denotes the enriched pathway and enriched index −log (P value), respectively.

