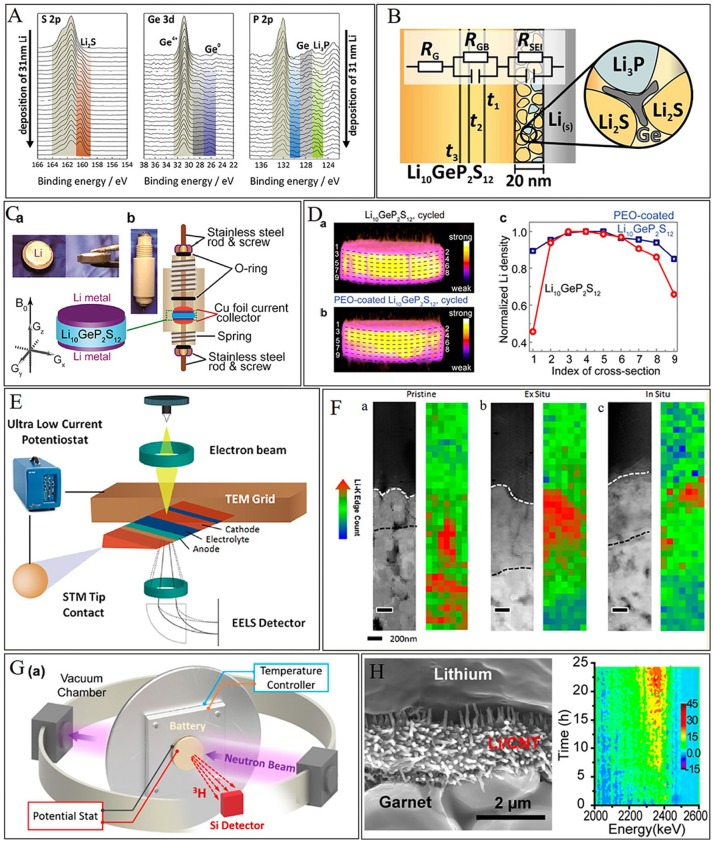
Figure 9.
In situ characterization techniques for solid-solid interface stability. (A) in situ XPS recorded during deposition of Li metal on LGPS. With increasing Li deposition time, LGPS decomposes. (B) Schematic of the interphase formation at the Li/LGPS interface according to the XPS result. [Reprinted with permission from (Wenzel et al., 2016). Copyright (2016) American Chemical Society]. (C) Pictures and schematic of a cylindrical cell for MRI. (D) Li density profiles at different depths of electrochemically cycled LGPS pellets. [Reprinted with permission from (Chien et al., 2018). Copyright (2018) American Chemical Society]. (E) Schematic of in situ TEM biasing of nanobattery. (F) STEM image and EELS characterization. (a–c) HAADF image of the nanobattery stack along with Li K-edge concentration mapping of (a) pristine, (b) ex situ, and (c) in situ samples with scale bar represents 200 nm. [Reprinted with permission from Wang et al. (2016b). Copyright (2016) American Chemical Society]. (G) Schematic of the NDP system. (H) 2D projection of the NDP spectra collected at 5 min intervals during cycling. [Reprinted with permission from (Wang et al., 2017a). Copyright (2017) American Chemical Society].

