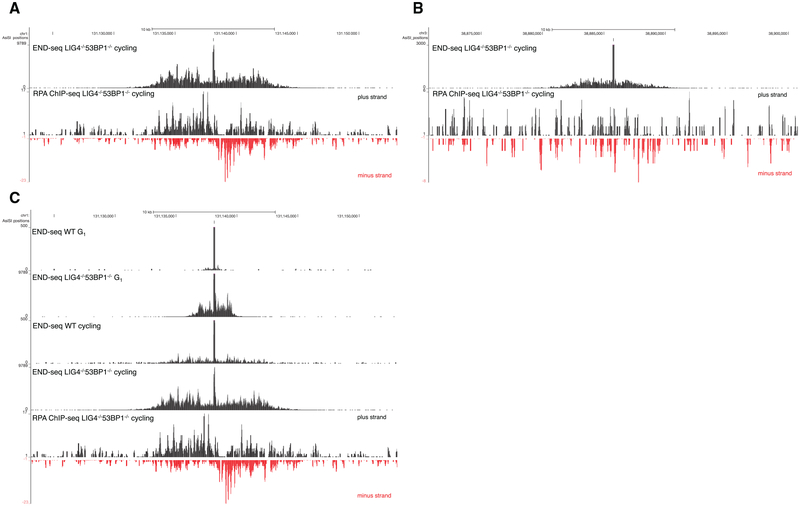
Figure 4. Nucleotide Resolution Mapping of End Resection.
(A) Top panel shows END-seq tracks surrounding an AsiSI DSB generated in Lig4−/− 53BP1−/−cycling pre-B cells. The accumulation of reads away from the DSB is indicative of end resection. Bottom panel shows the read coverage for RPA ChIP-seq for the same interval
(B) END-seq and RPA ChIP-seq reads for an AsiSI site distinct from that shown in (A). RPA ChIP-seq is not detectable above background for this site.
(C) End resection in G1-arrested versus cycling pre-B cells. The bottom track shows RPA ChIP-seq reads for the same interval. End resection is greater in cycling cells than arrested cells.
See also Figure S3.

