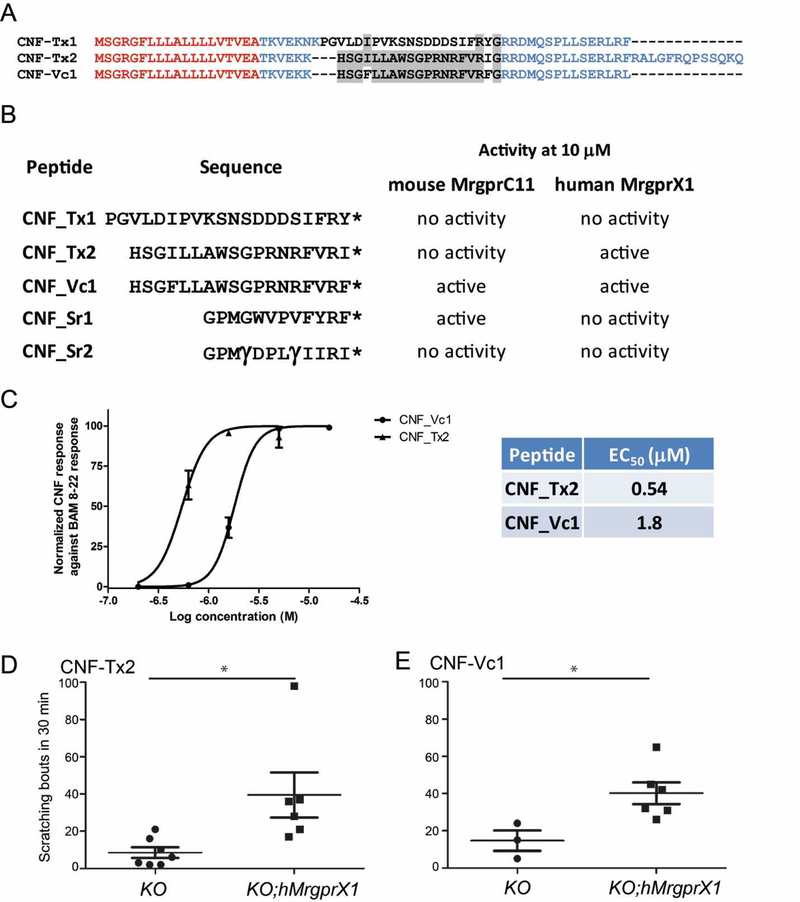
Figure 2.
A) Sequence alignment of the precursor structure of CNF-Tx1, CNF-Tx2 and CNF-Vc1 (27). Sequences in red denote the signal sequence those in blue are the propeptide sequence and sequences in black are the toxin sequence. Note the conserved C-terminal RF(I)-amide motif. Conserved amino acids between toxin sequences are highlighted in grey. B) Peptides that were tested for activity against MrgprC11 and hMrgprX1. The activity of each peptide against MrgprC11 and hMrgprX1 at 10 µM is indicated. * indicates a C-terminal amide; γ indicates γ-carboxyglutamate. C) Concentration-dependent activation of hMrgprX1 by CNF-Tx2 and CNF-Vc1. Each data point is the average of at least 3 experiments. Error bars represents SEM. D) Cheek injection of CNF-Tx2 (10 nM) and E) CNF-Vc1 (10 nM) into hMrgprX1;Mrgpr-cluster∆−/− (KO;hMrgprX1) mouse induces significant itch-related scratching versus control Mrgprcluster∆−/− (KO). Different sets of mice were used for the CNF-Tx2 and CNF-Vc1 experiments. Each dot represents data from an individual mouse. Data are presented as mean ± SEM. *, P<0.05; two tailed unpaired t-test. The p value for each peptide compared against the control are: CNF-Tx2, p = 0.0217; CNF-Vc1, p = 0.0489

