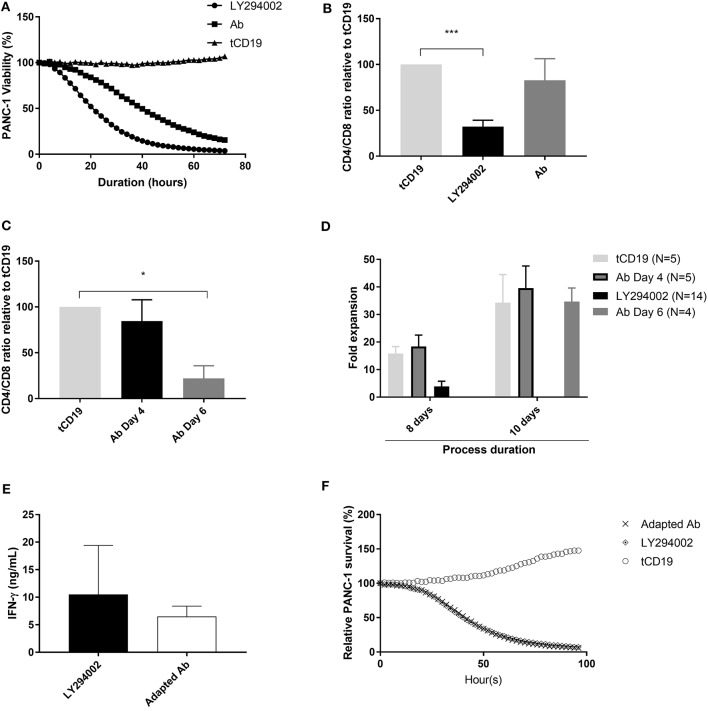
Figure 4.
NKR-2 T cells Ab blockade process adaptation restores CD4/CD8 ratio. (A) Cytolytic activity kinetics, one representative killing assay out of three. Thawed control tCD19 T cells or NKR-2 T cells treated with PI3K inhibitor LY294002 or with the blocking Ab were cultured in presence of NucLight positive PANC-1. PANC-1 viability was assessed every 2 h by the IncuCyte S3 device. (B) CD4/CD8 distribution at harvest. During expansion phase, NKR-2 T cells were either cultured with 5 μM of LY294002 or with 5 μg/mL of blocking Ab for 96 h, harvested and measured by Flow cytometry for the CD4 and CD8 population. Data shown are mean ± SD of N = 4 independent T cell donors relative to the control tCD19 ratio. (C) CD4/CD8 distribution at harvest with a delayed addition of blocking Ab. During expansion phase (day 4 to day 8), NKR-2 T cells were either directly treated with 5 μM of blocking Ab (day 4) or after 48h (day 6). At harvest (day8), T cells were harvested and analyzed by Flow cytometry for the CD4 and CD8 populations. Data shown are mean ± SD of N = 3 independent T cell donors relative to control tCD19 CD4/CD8 ratio. (D) Comparison of expansion. NKR-2 T cells were either cultured for 8 or 10 days in presence of LY or blocking Ab (added at day 4 or at day 6). T cells were analyzed at harvest for fold expansion relative to the initial cell seeding density. (E) Potency assay by IFN-γ secretion. Thawed NKR-2 T cells processed by the two methods were cocultured in presence of PANC-1 cells. IFN-γ secretion was measured by ELISA after 44 h of co-culture. Data shown are mean ± SD of N = 4 independent T cell donors. (F) Cytolytic activity kinetics, one representative killing assay out of three. Thawed control tCD19 T cells or NKR-2 T cells treated with PI3Ki or with the blocking antibody were cultured in presence of NucLight positive PANC-1 cells. PANC-1 viability was assessed every 2 h by the IncuCyte S3 device. A two-tailed unpaired t-test was used to assess statistical significance. A p < 0.05 was considered significant *p < 0.01 and ***p < 0.001.

