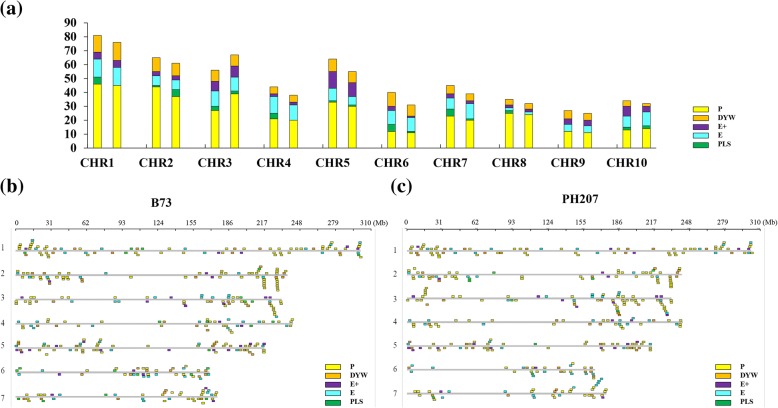
Fig. 1.
Numbers of genes in different subclasses and distribution of the PPR genes. a Numbers of genes in the five subclasses (P, E+, E, DYW, PLS) on each chromosome in B73 and PH207. The left column represents the B73 genome, and the right column represents the PH207 genome. b Genomic distribution of PPP genes in the B73 genome. The X axis represents the physical location. c Genomic distribution of the PPR genes in the PH207 genome. The X axis represents the physical location

