
Fig. 2.
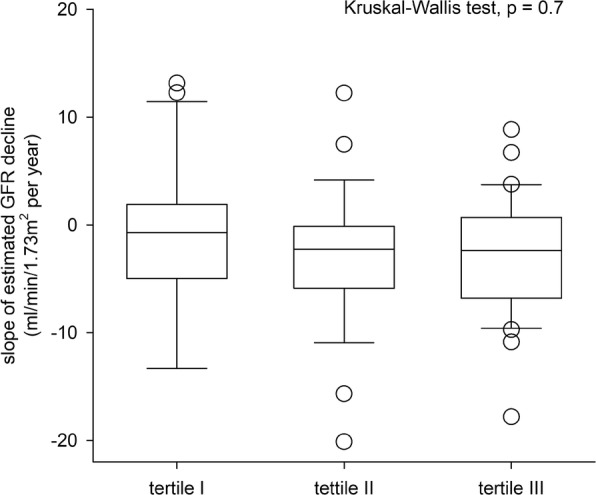
The relation between urinary mitochondrial DNA (mtDNA) level tertiles and the rate of estimated glomerular filtration rate (GFR) decline. Tertile I had the lowest while tertile III the highest urinary mtDNA level. Whisker-box plot, with boxes indicate median, 25th and 75th percentiles, whiskers indicate 5th and 95th percentiles. Data are compared by Kruskal Wallis test